Backbone
Role
Frontend Developer
UI/UX Design
Branding
User Research
Fundraising
Head of Design
Product Management
Motion Designer
Prototyping
Team Size
3 ︎ 9
Team
CEO – Rajesh Chandran
Engineering – Ben Demaree, Brent Clack, Brennan Payne, Vic Patil
Customer Success – Jackie Tang
Hardware Lead – Rory Nordeen
Deliverables
Desktop browser MVP
Mobile Delivery, Scan, & Weight app
Culture around design thinking
Interface component design system
48+ features
Backbone set out to understand which part of the cannabis industry would benefit the most from modern software and understand how to improve the daily experience of those operators. Government regulation and compliance was coming fast in California and already existed in other states. Backbone’s mission was to ease that burden and make it delightful. We went from a market and an idea to a product with customers.
Business Opportunity
State mandated compliance was coming up.
$60MM / month of cannabis was being processed in California.
A comparable SaaS ERP company's value is $500MM in 5 years.
State mandated compliance was coming up.
$60MM / month of cannabis was being processed in California.
A comparable SaaS ERP company's value is $500MM in 5 years.
Personal Challenges
🌿 Learn more than I'd ever imagine about cannabis and manufacturing.
⚖️ Balance where to apply my design time as a solo designer supporting a team of developers rapidly developing features.
🌿 Learn more than I'd ever imagine about cannabis and manufacturing.
⚖️ Balance where to apply my design time as a solo designer supporting a team of developers rapidly developing features.
Goals
Bring modern manufacturing software, delight, and peace of mind to the soon the be regulated cannabis market.
Become the all in one solution for hardware and software across the entire cannabis pipeline.
Design and market our offering to other industries including beer, coffee, and chocolate.
Bring modern manufacturing software, delight, and peace of mind to the soon the be regulated cannabis market.
Become the all in one solution for hardware and software across the entire cannabis pipeline.
Design and market our offering to other industries including beer, coffee, and chocolate.
Validate
Weekly meetings and interviews with users/customer on feature development and needs.
On site observation of their working process.
Quantitative analysis using Mixpanel and Fullstory.
Post feature release analytics check for usage and user behavior.
Weekly meetings and interviews with users/customer on feature development and needs.
On site observation of their working process.
Quantitative analysis using Mixpanel and Fullstory.
Post feature release analytics check for usage and user behavior.
Research + Inspiration
Qualitative Research – Talks with domain experts to build empathy and understanding.
Quantitative Research – Analysis of market trends to identify business potential.
Competitive Analysis – Audit both legacy ERP companies and cannabis specific SaaS.
Inspiration – Dissect innovative modern day productivity tools (Notion + Airtable for table design guidelines and micro interactions)
Outcome
ARR of 300k with bookings worth 1MM+
More customers then the team can handle.
ARR of 300k with bookings worth 1MM+
More customers then the team can handle.
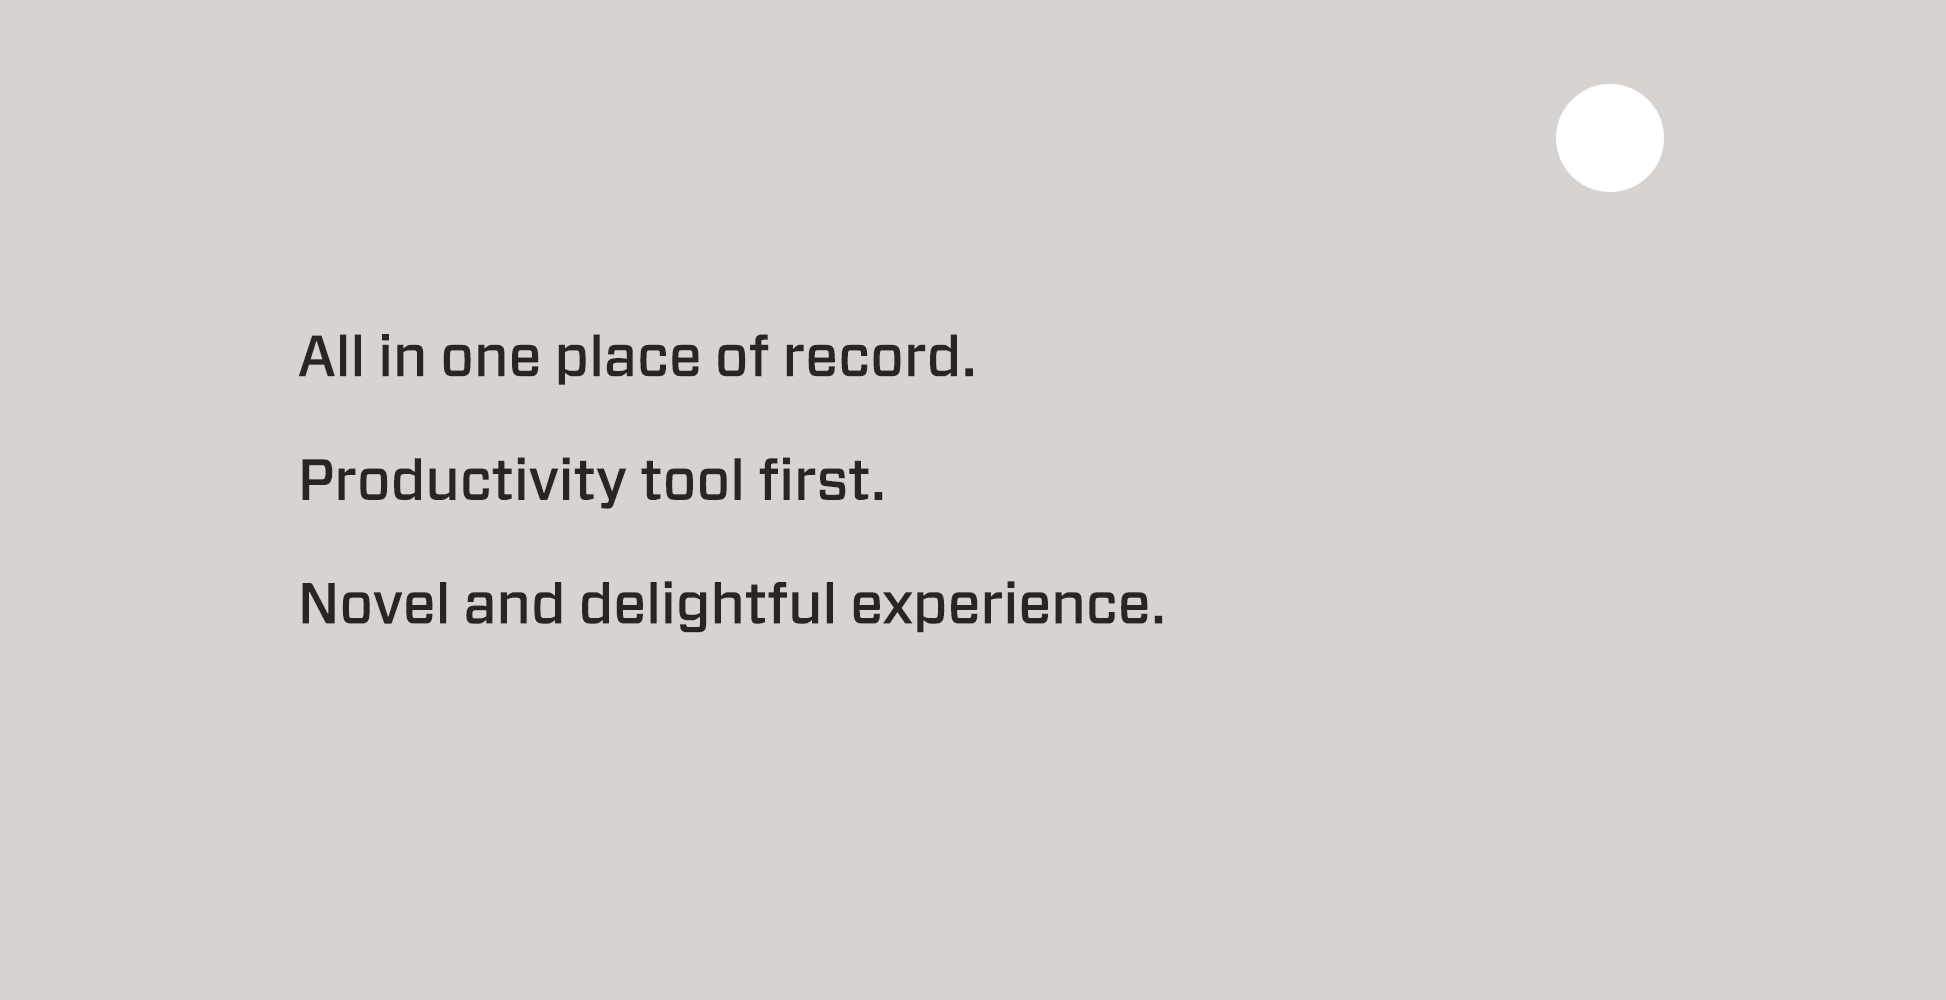
Philosophy Foundation
We created a shared foundation for what we believe a success product would look like. Everyone worked with this mentality.

Personas
After we identified manufacturing to be the most profitable and important segment of the cannabis pipeline, we worked with early partner customers to identify our user personas.
As an analyst, I need to know how much oil was produced today/this week/this month/this quarter.
As a machine operator, I need to enter my production runs.
As an admin I need to predict supply and demand through the entire ecosystem.
As an admin I need a way to visually explain my production processes.
- Analyst – Fine tune your process
-
Operator – Machine production + crafting
- Admin – Configure at the macro level
As an analyst, I need to know how much oil was produced today/this week/this month/this quarter.
As a machine operator, I need to enter my production runs.
As an admin I need to predict supply and demand through the entire ecosystem.
As an admin I need a way to visually explain my production processes.
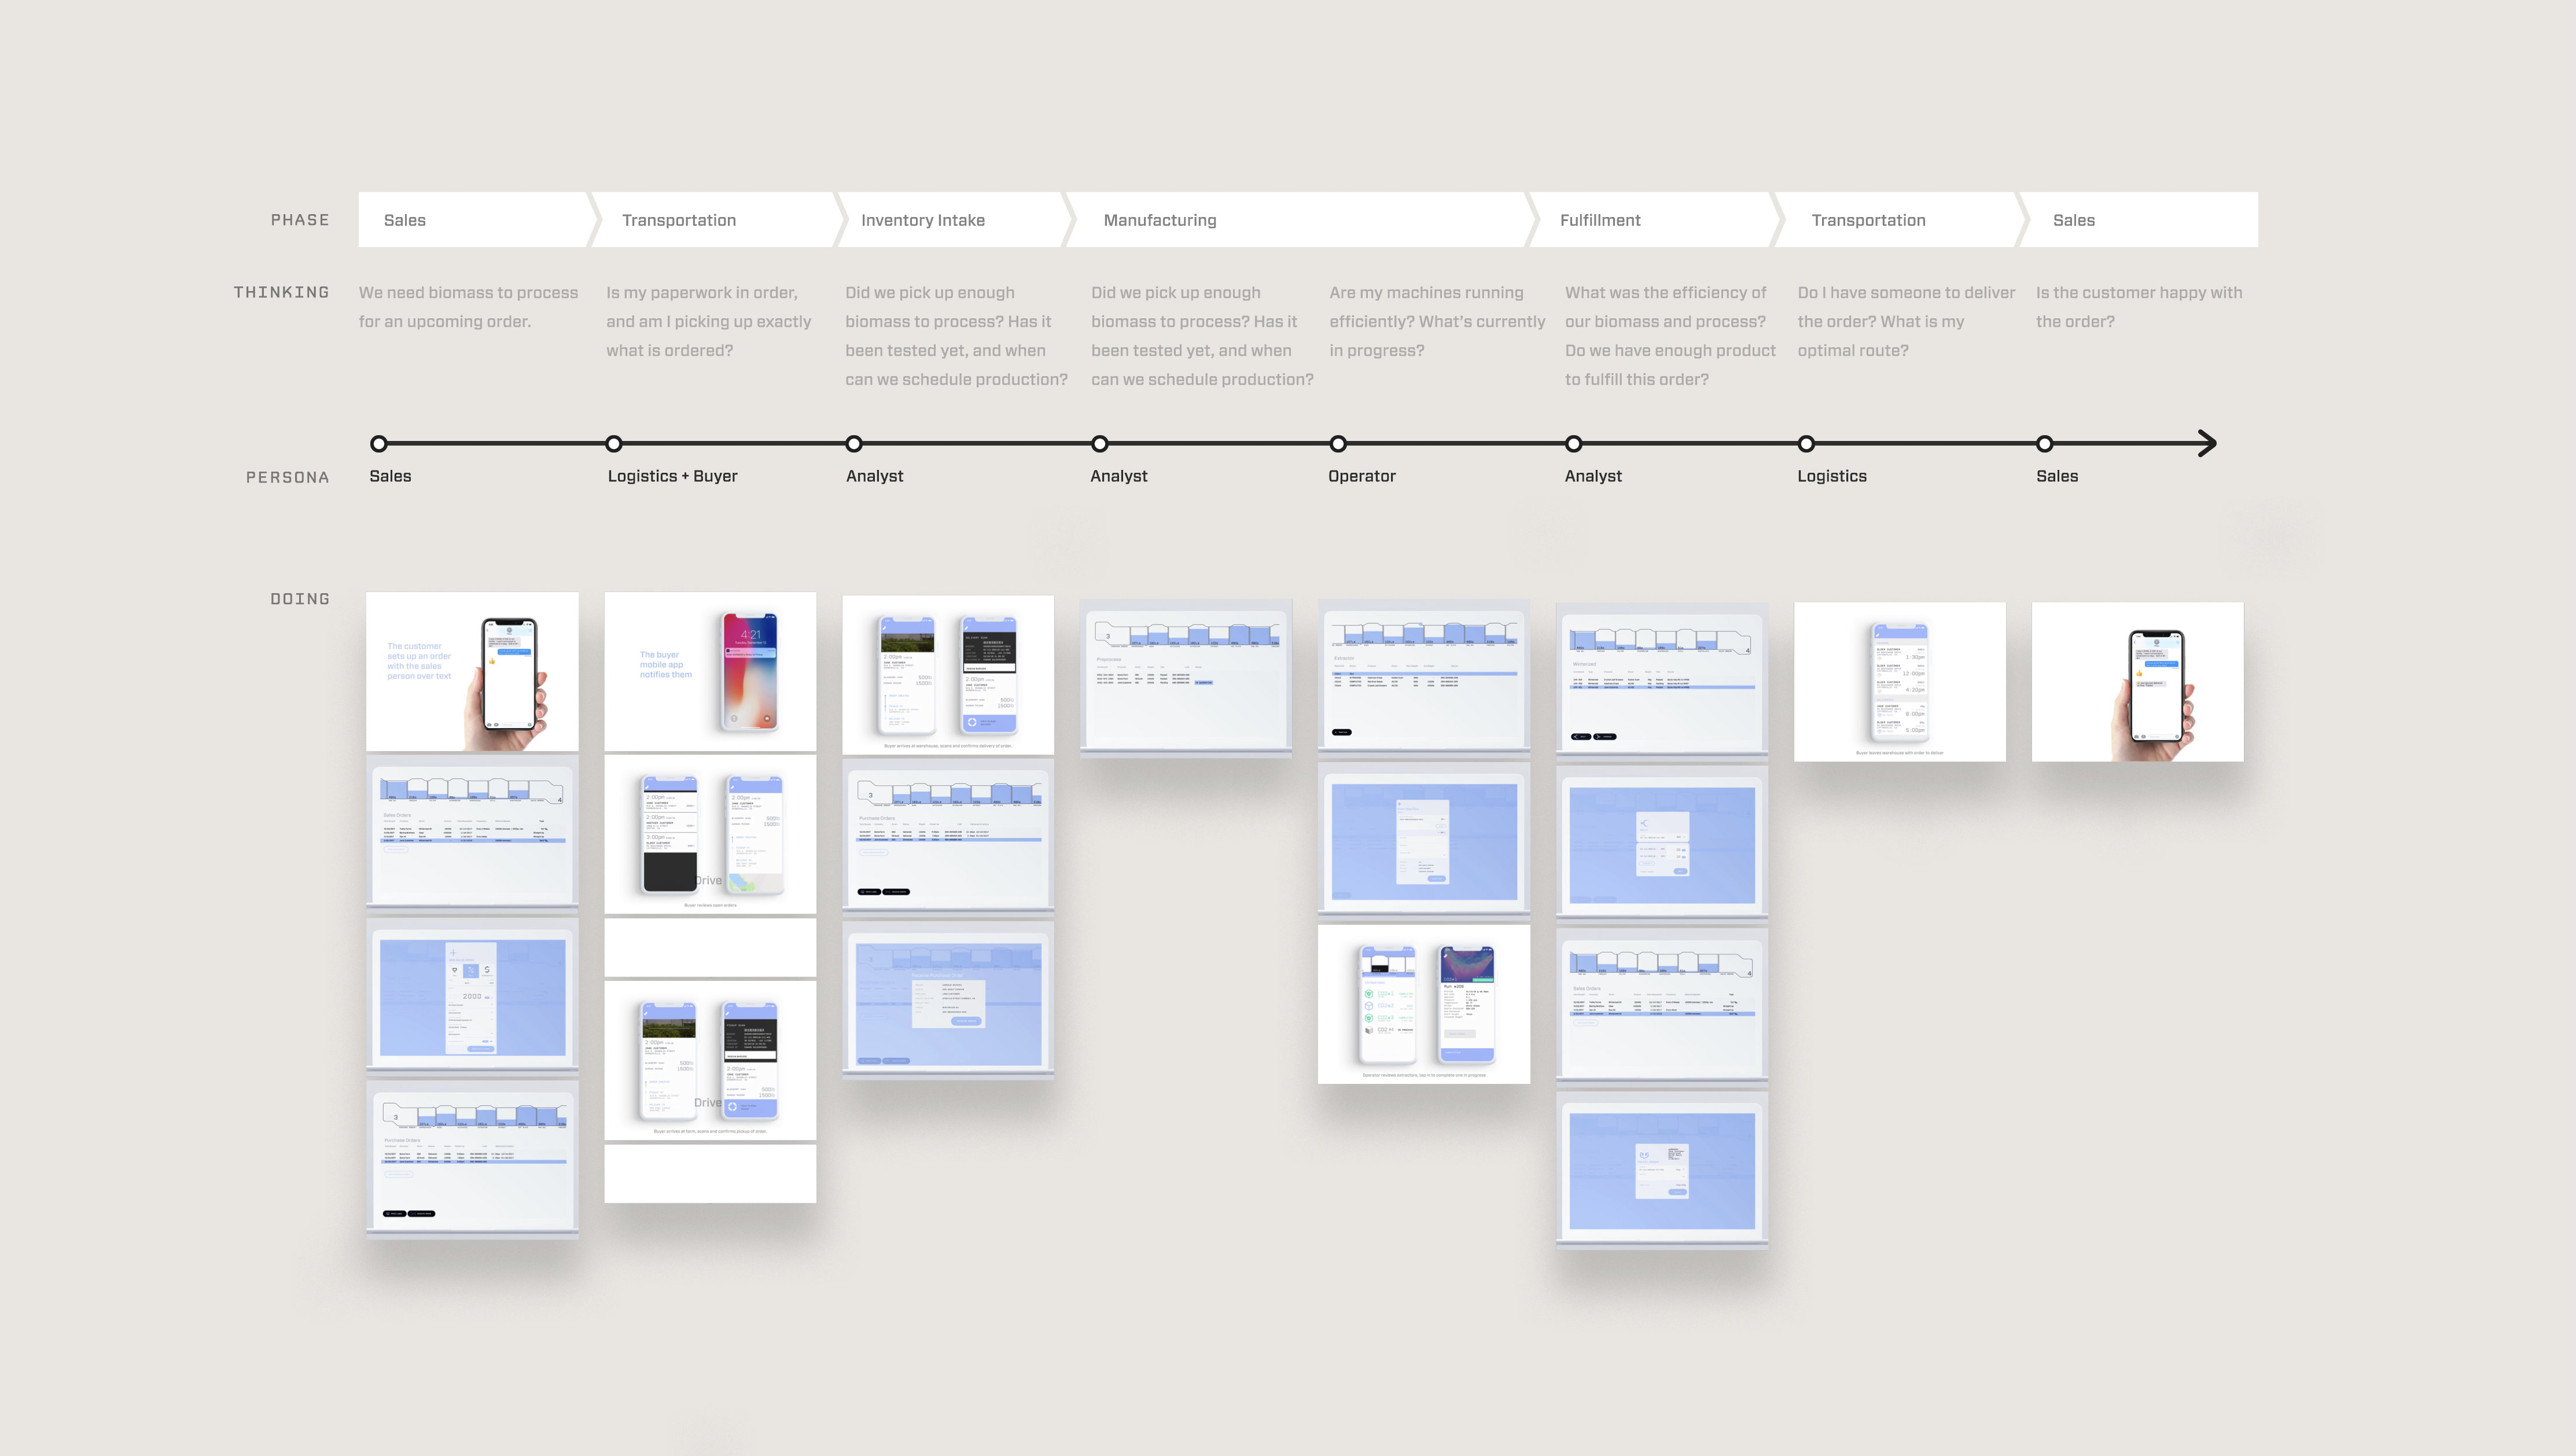
Journey Map
Early on during our MVP build we identified every touch point Backbone could have inside our segment of the canabis pipeline.

Mobile Order – Scan confirmation for system intake during delivery.

Custom Circuit Board for our flow meters used in manufacturing.
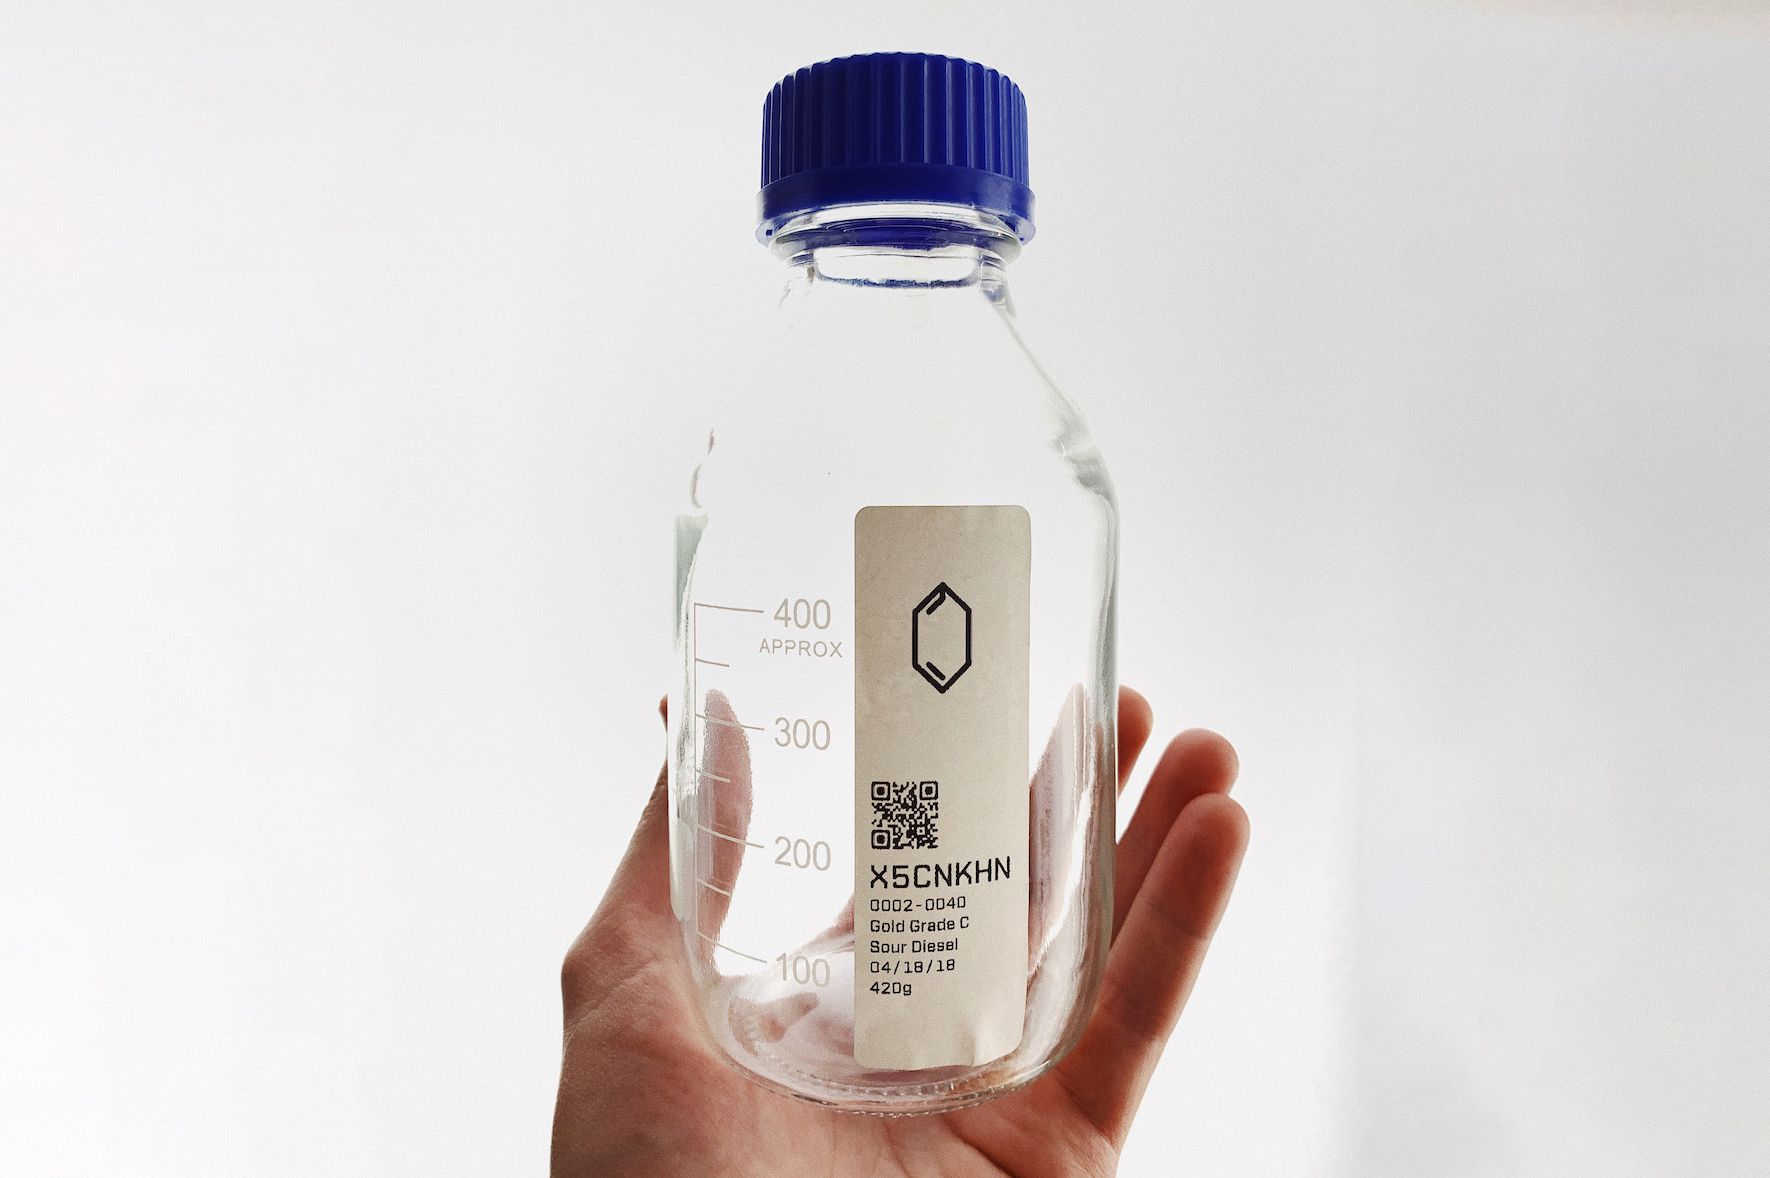

As part of our all in one solution approach we needed to provide a way to physically track material and inventory in the real world. We narrowed down on a Brother printer, and went through quick iterations to nail down sticker form factors we’d need to support. Field testing and in person research was done to discover the iA important to users for quick glanceability
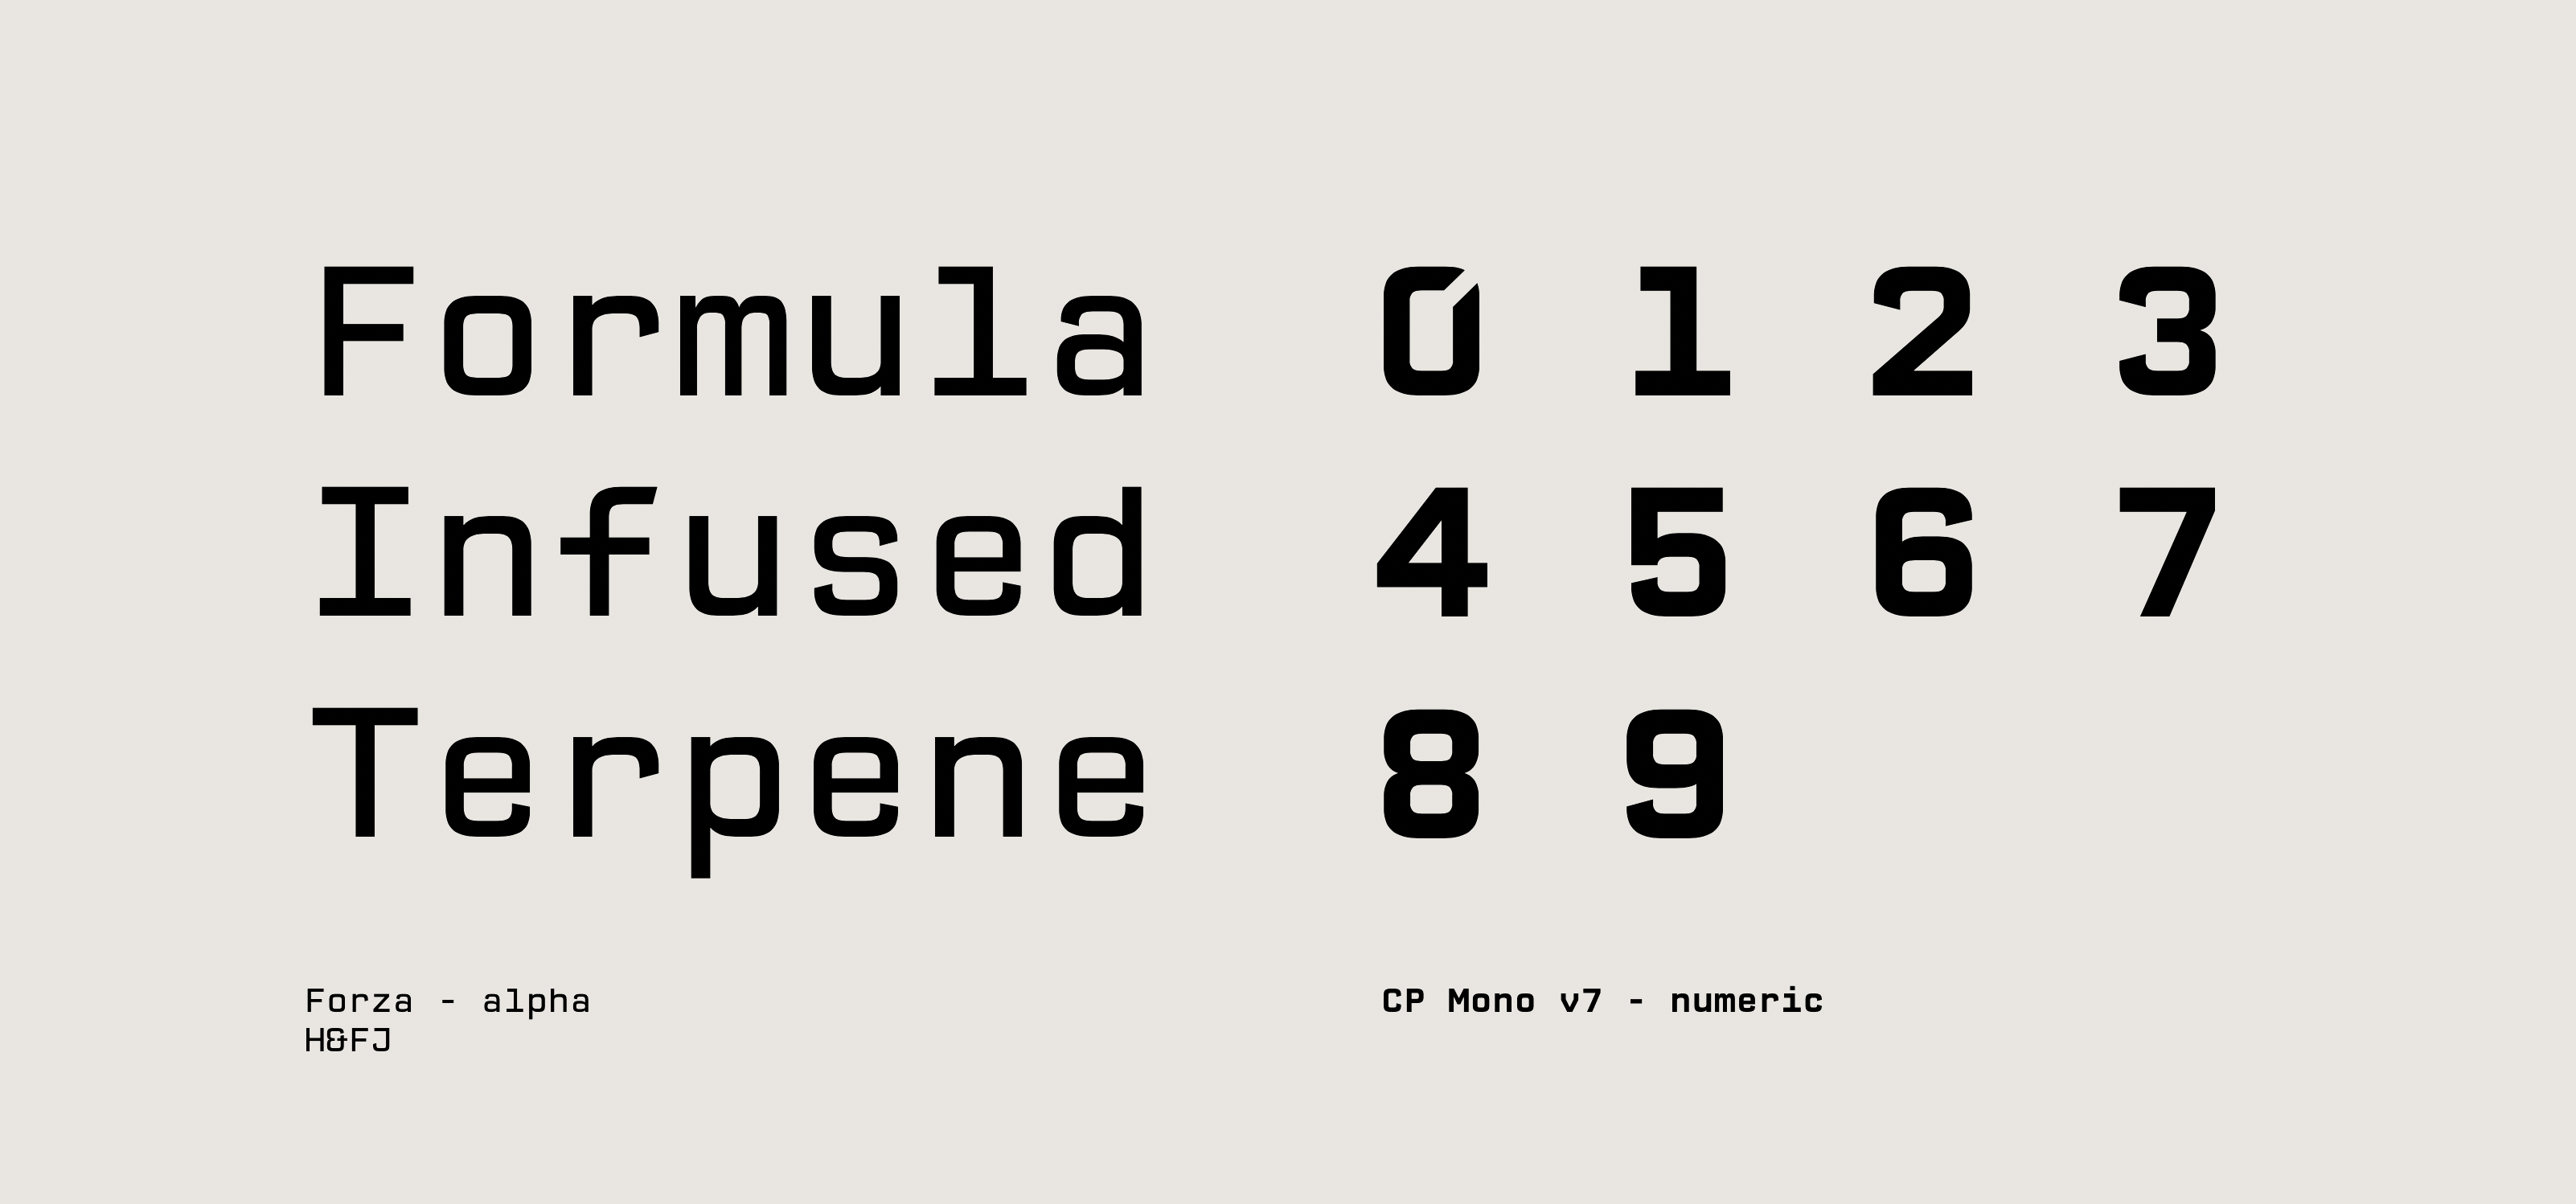
Typography
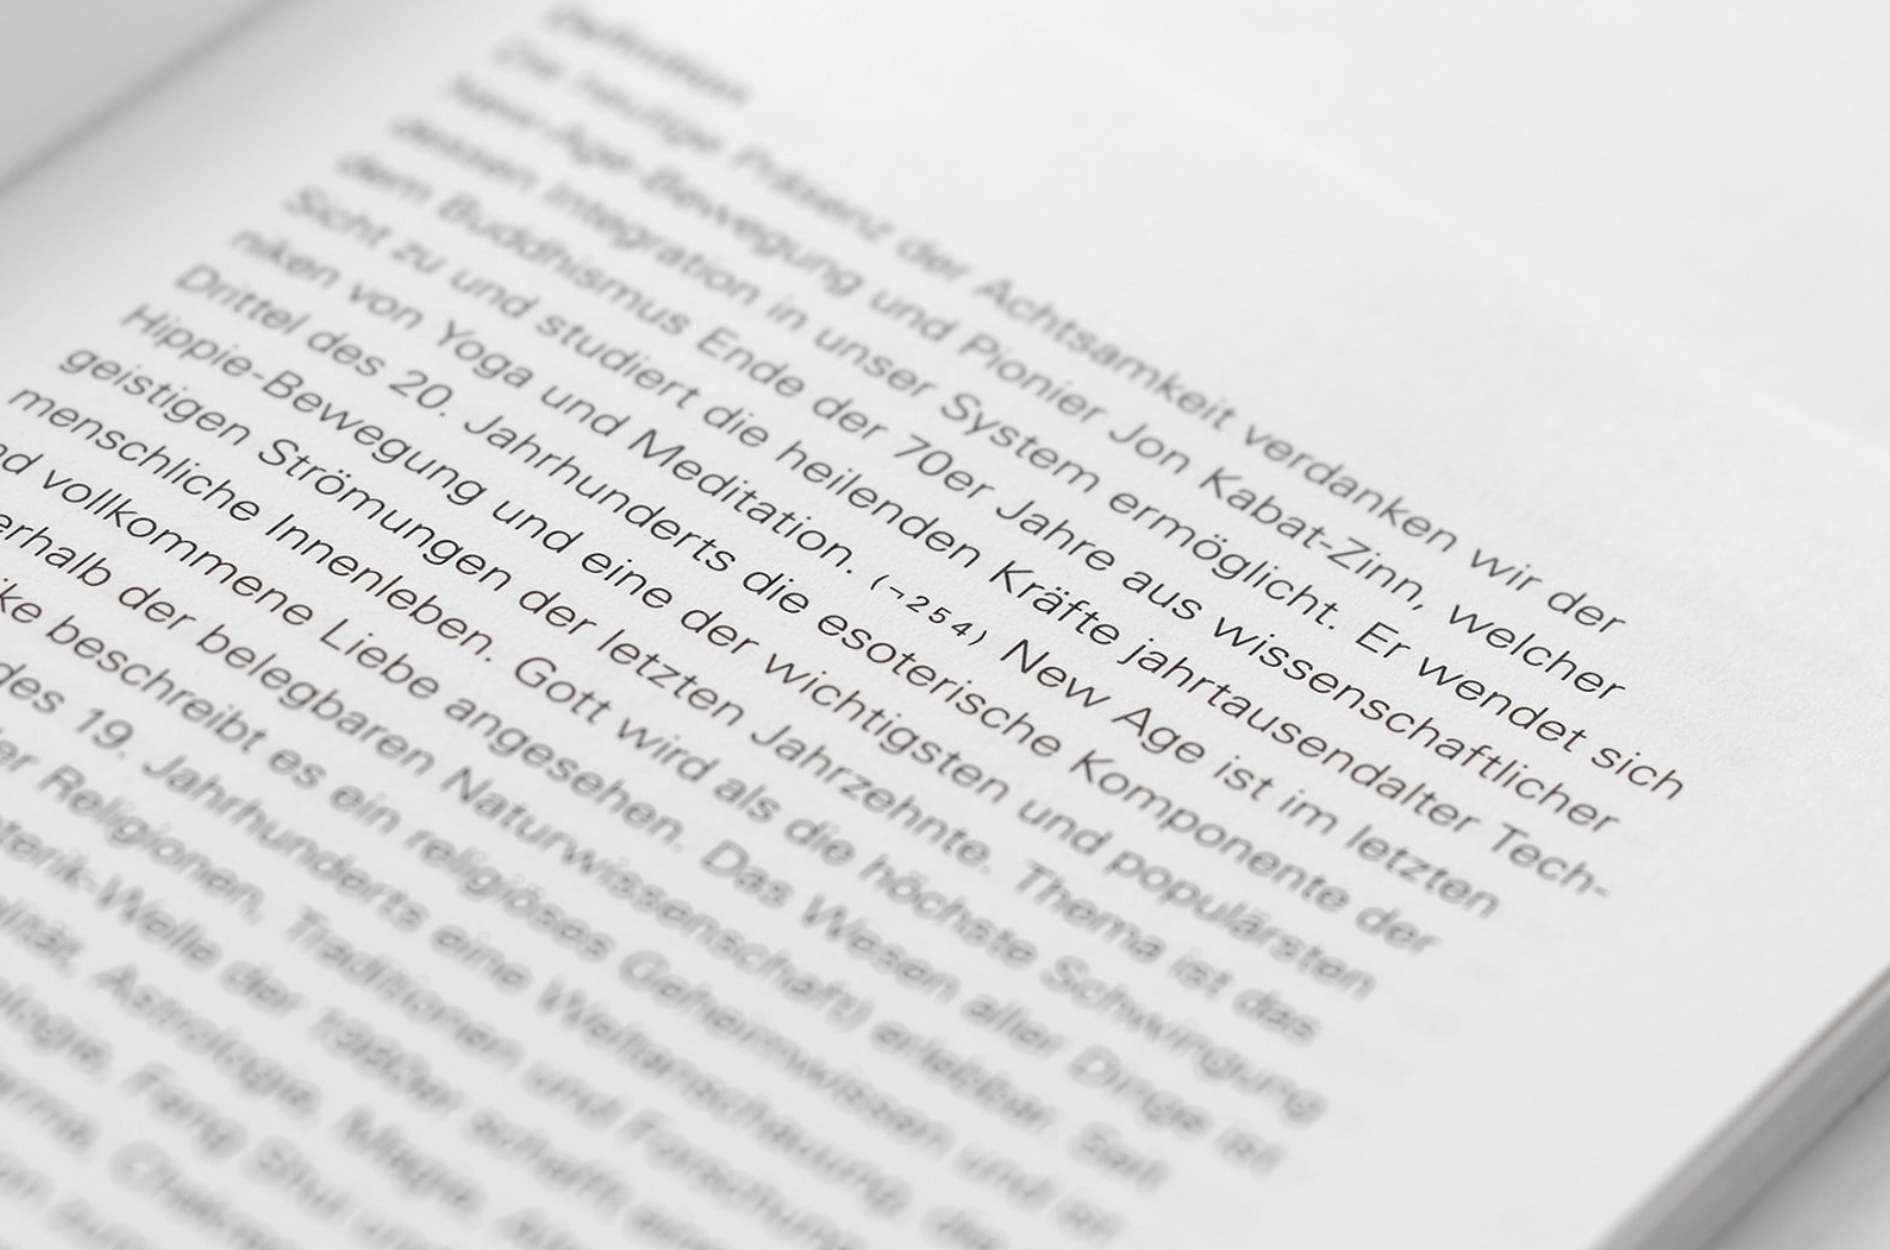
Typography was critical to the product because of its dense tabular data. After researching and prototyping different type families we ended on Forza for its designed use for tables of data at our pt size. We needed a monospaced font to pair for IDs, Lots, and numerical data for legibility. We chose an open source font called CP mono for it's similarity to Forza. We slightly modified the monospaced font for legibility with 0,O,D and to better match Forza.
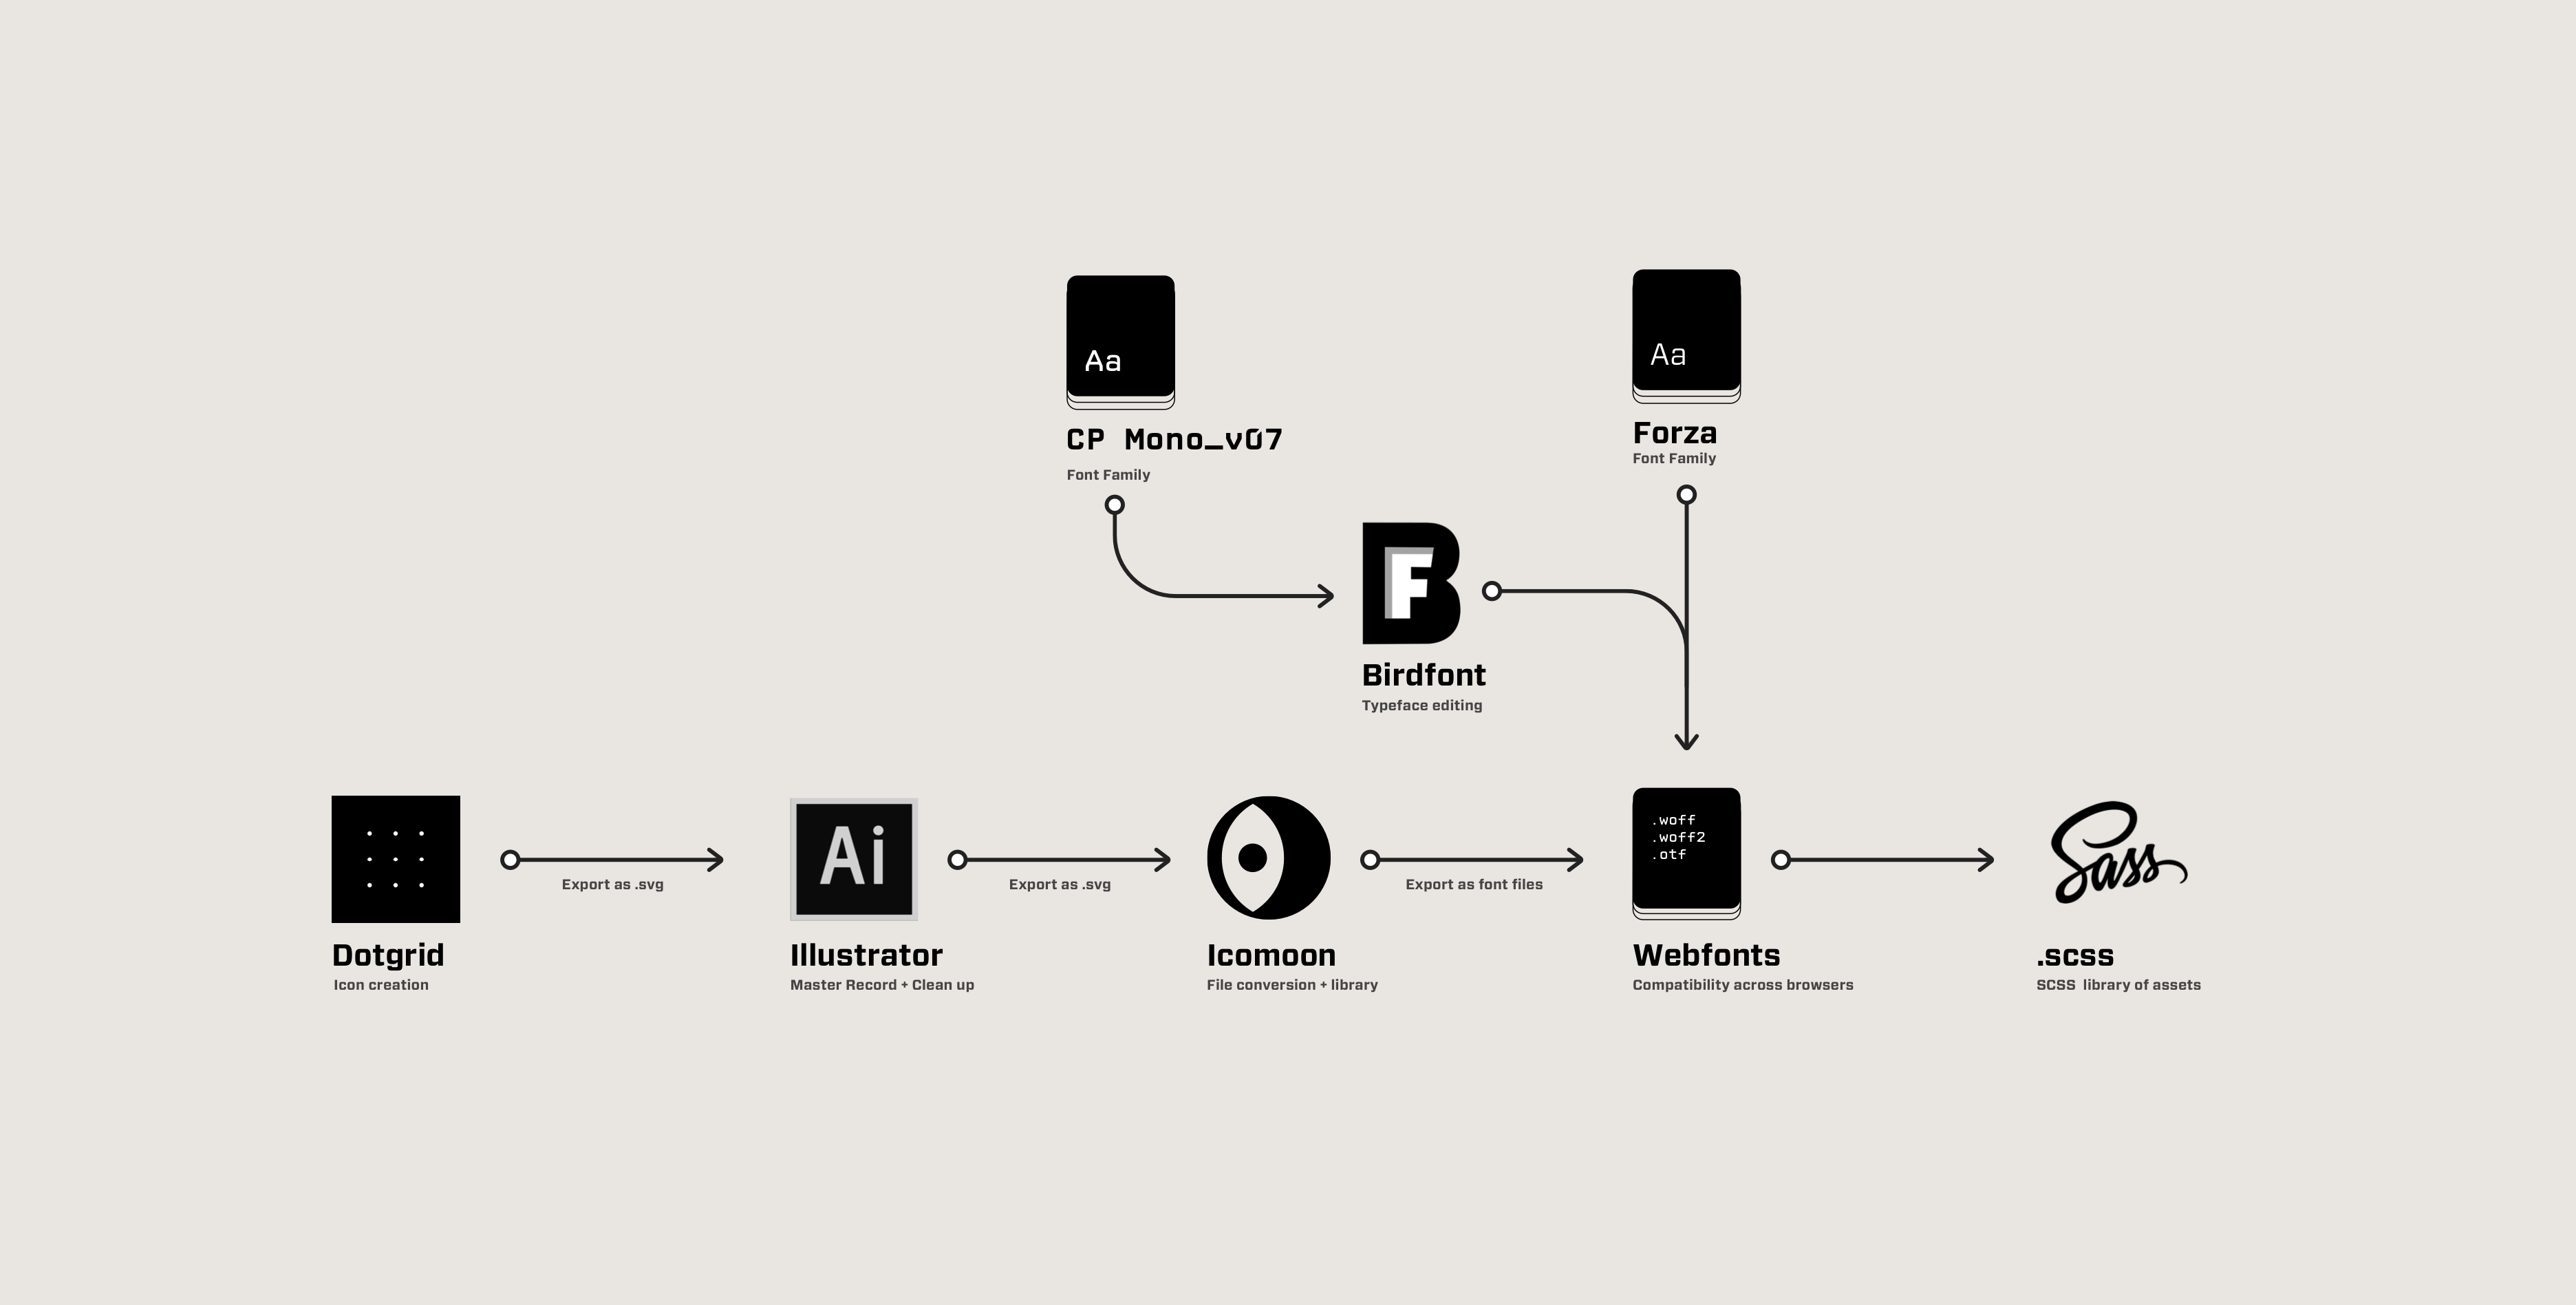
Icon & Font Flow
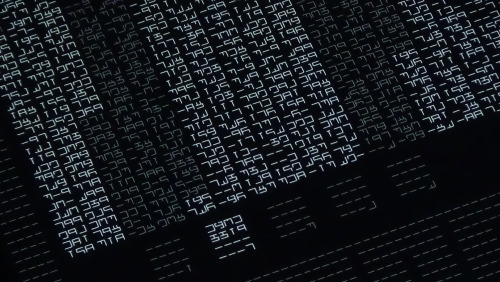
I see the software you use as the medium and tool of your craft. It has the power to dictate decisions before you even start. Much like if an artist used glass, clay, or wood for their piece; the software you use changes your outcome. Because of that we used Dotgrid, vector drawing program, to create all of our system and material icons.

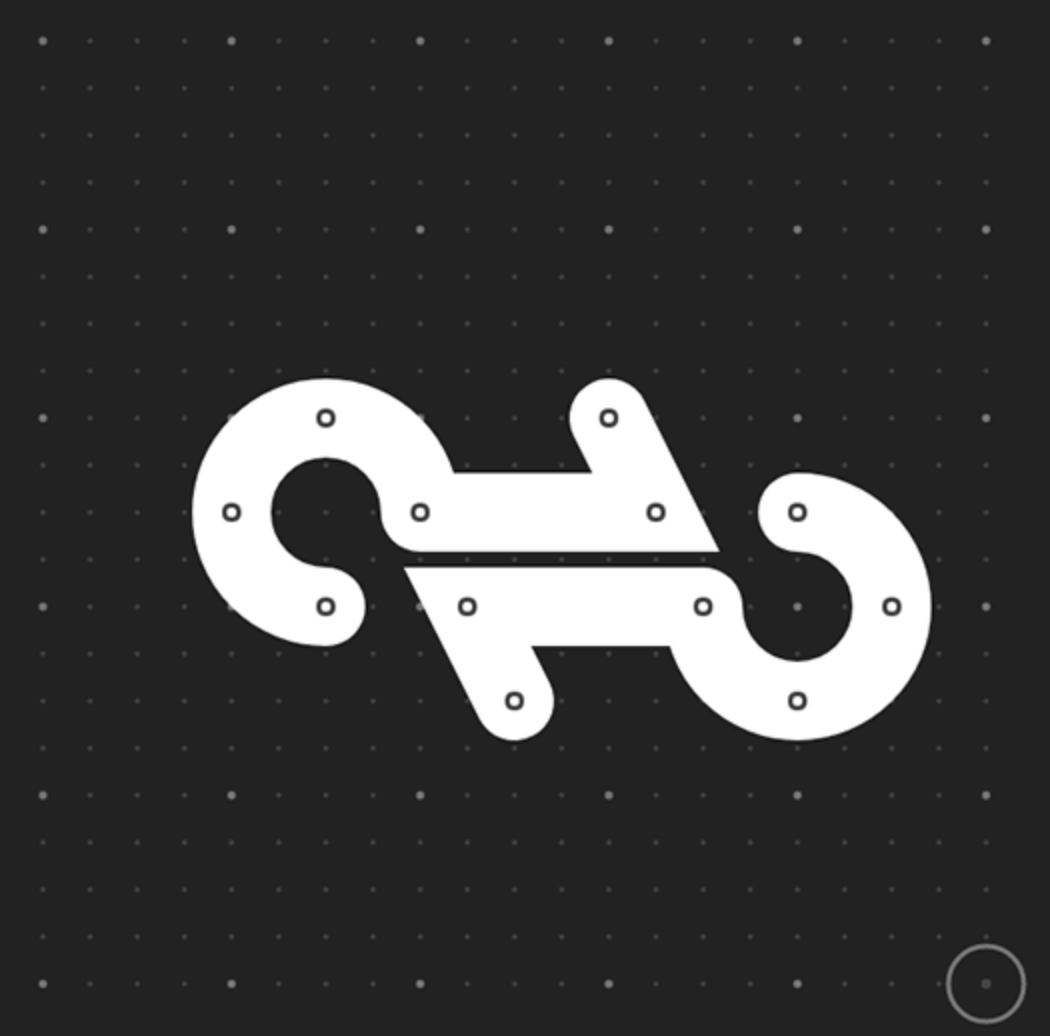
Custom created icons for system interactions and customer's inventory. All created with the vector drawing tool DotGrid. The tool you use influences your end result, and we want to match the minimal/futuristic art direction. We needed a solution to make materials quickly identifiable inside a dense table of data. Customers picked an icon for each unique raw material which helped emphasis the idea of 'material' as a record type inside our system.
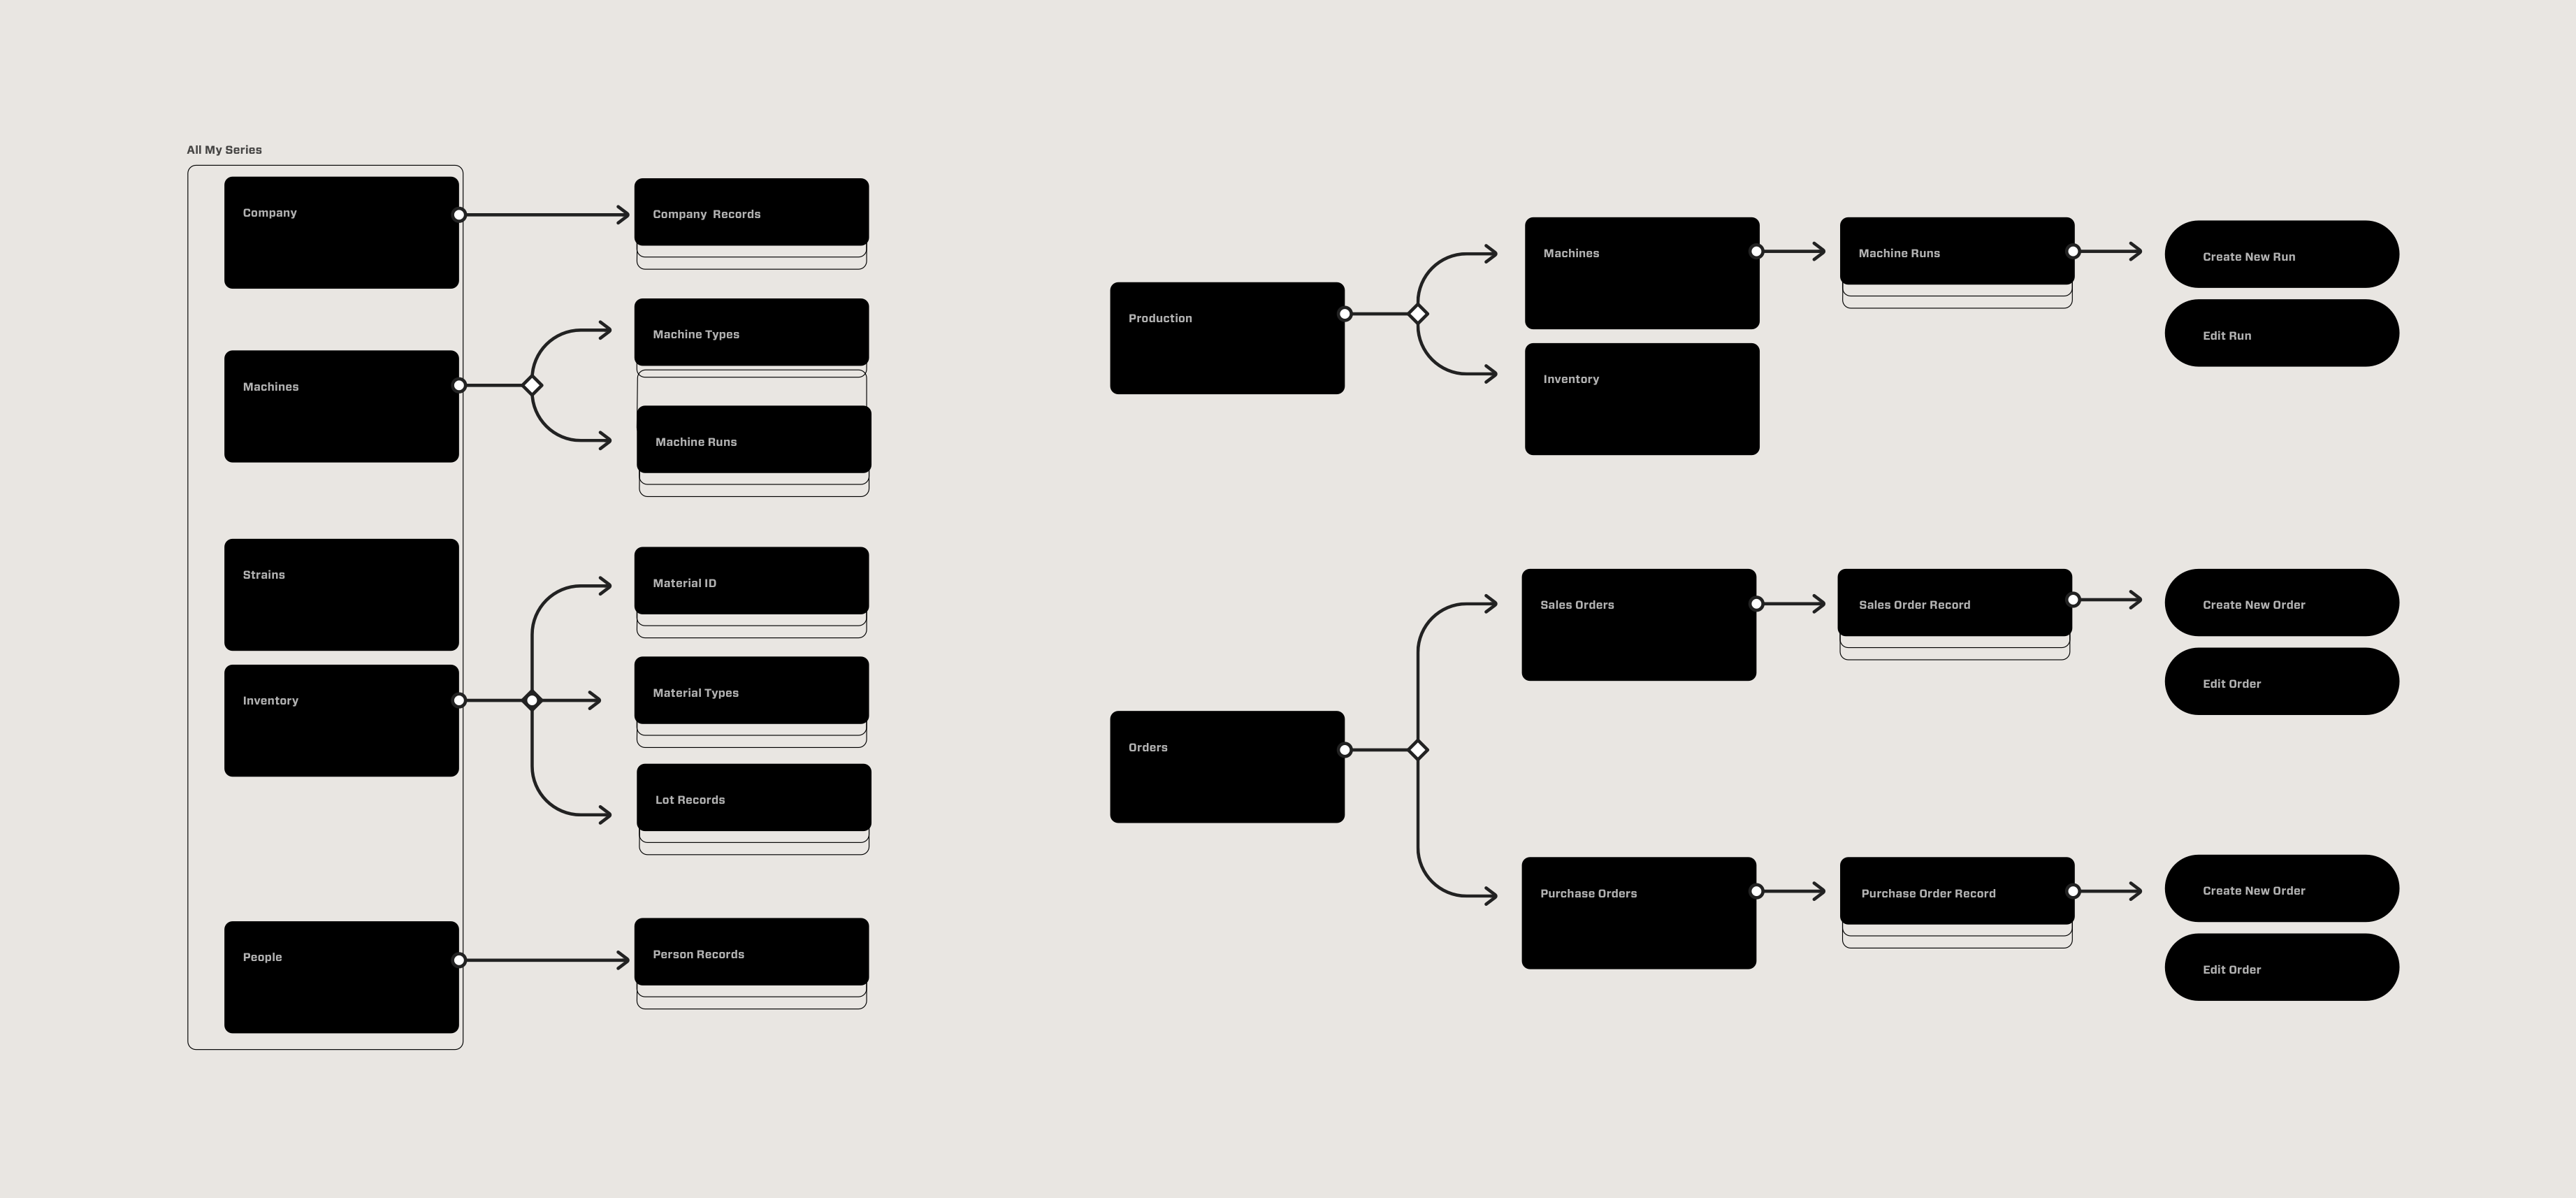
App Records
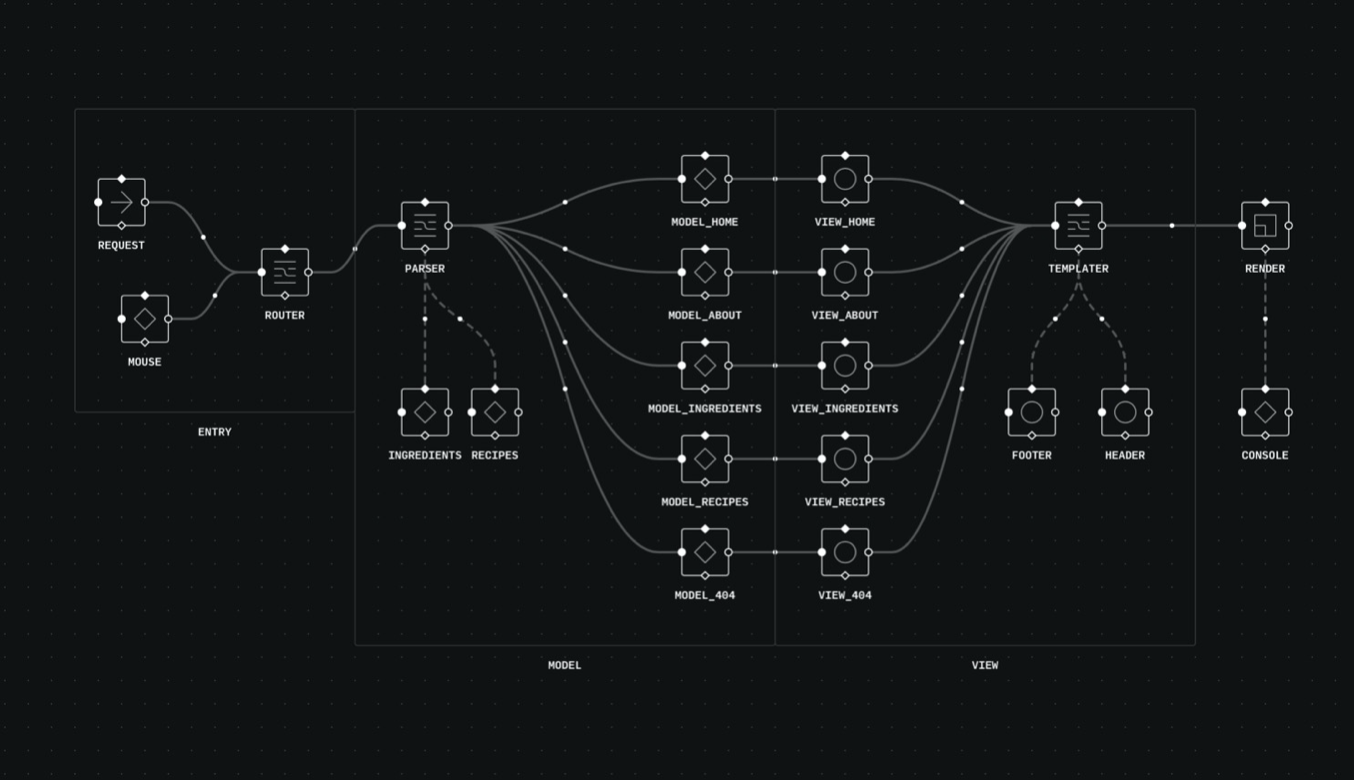
The app navigation was a loop where any record could lead to another. There were two main flows of Production and Orders. Our record structure had a parent hierarchy. Inventory and machines had Archetypes, subtypes, and variations.
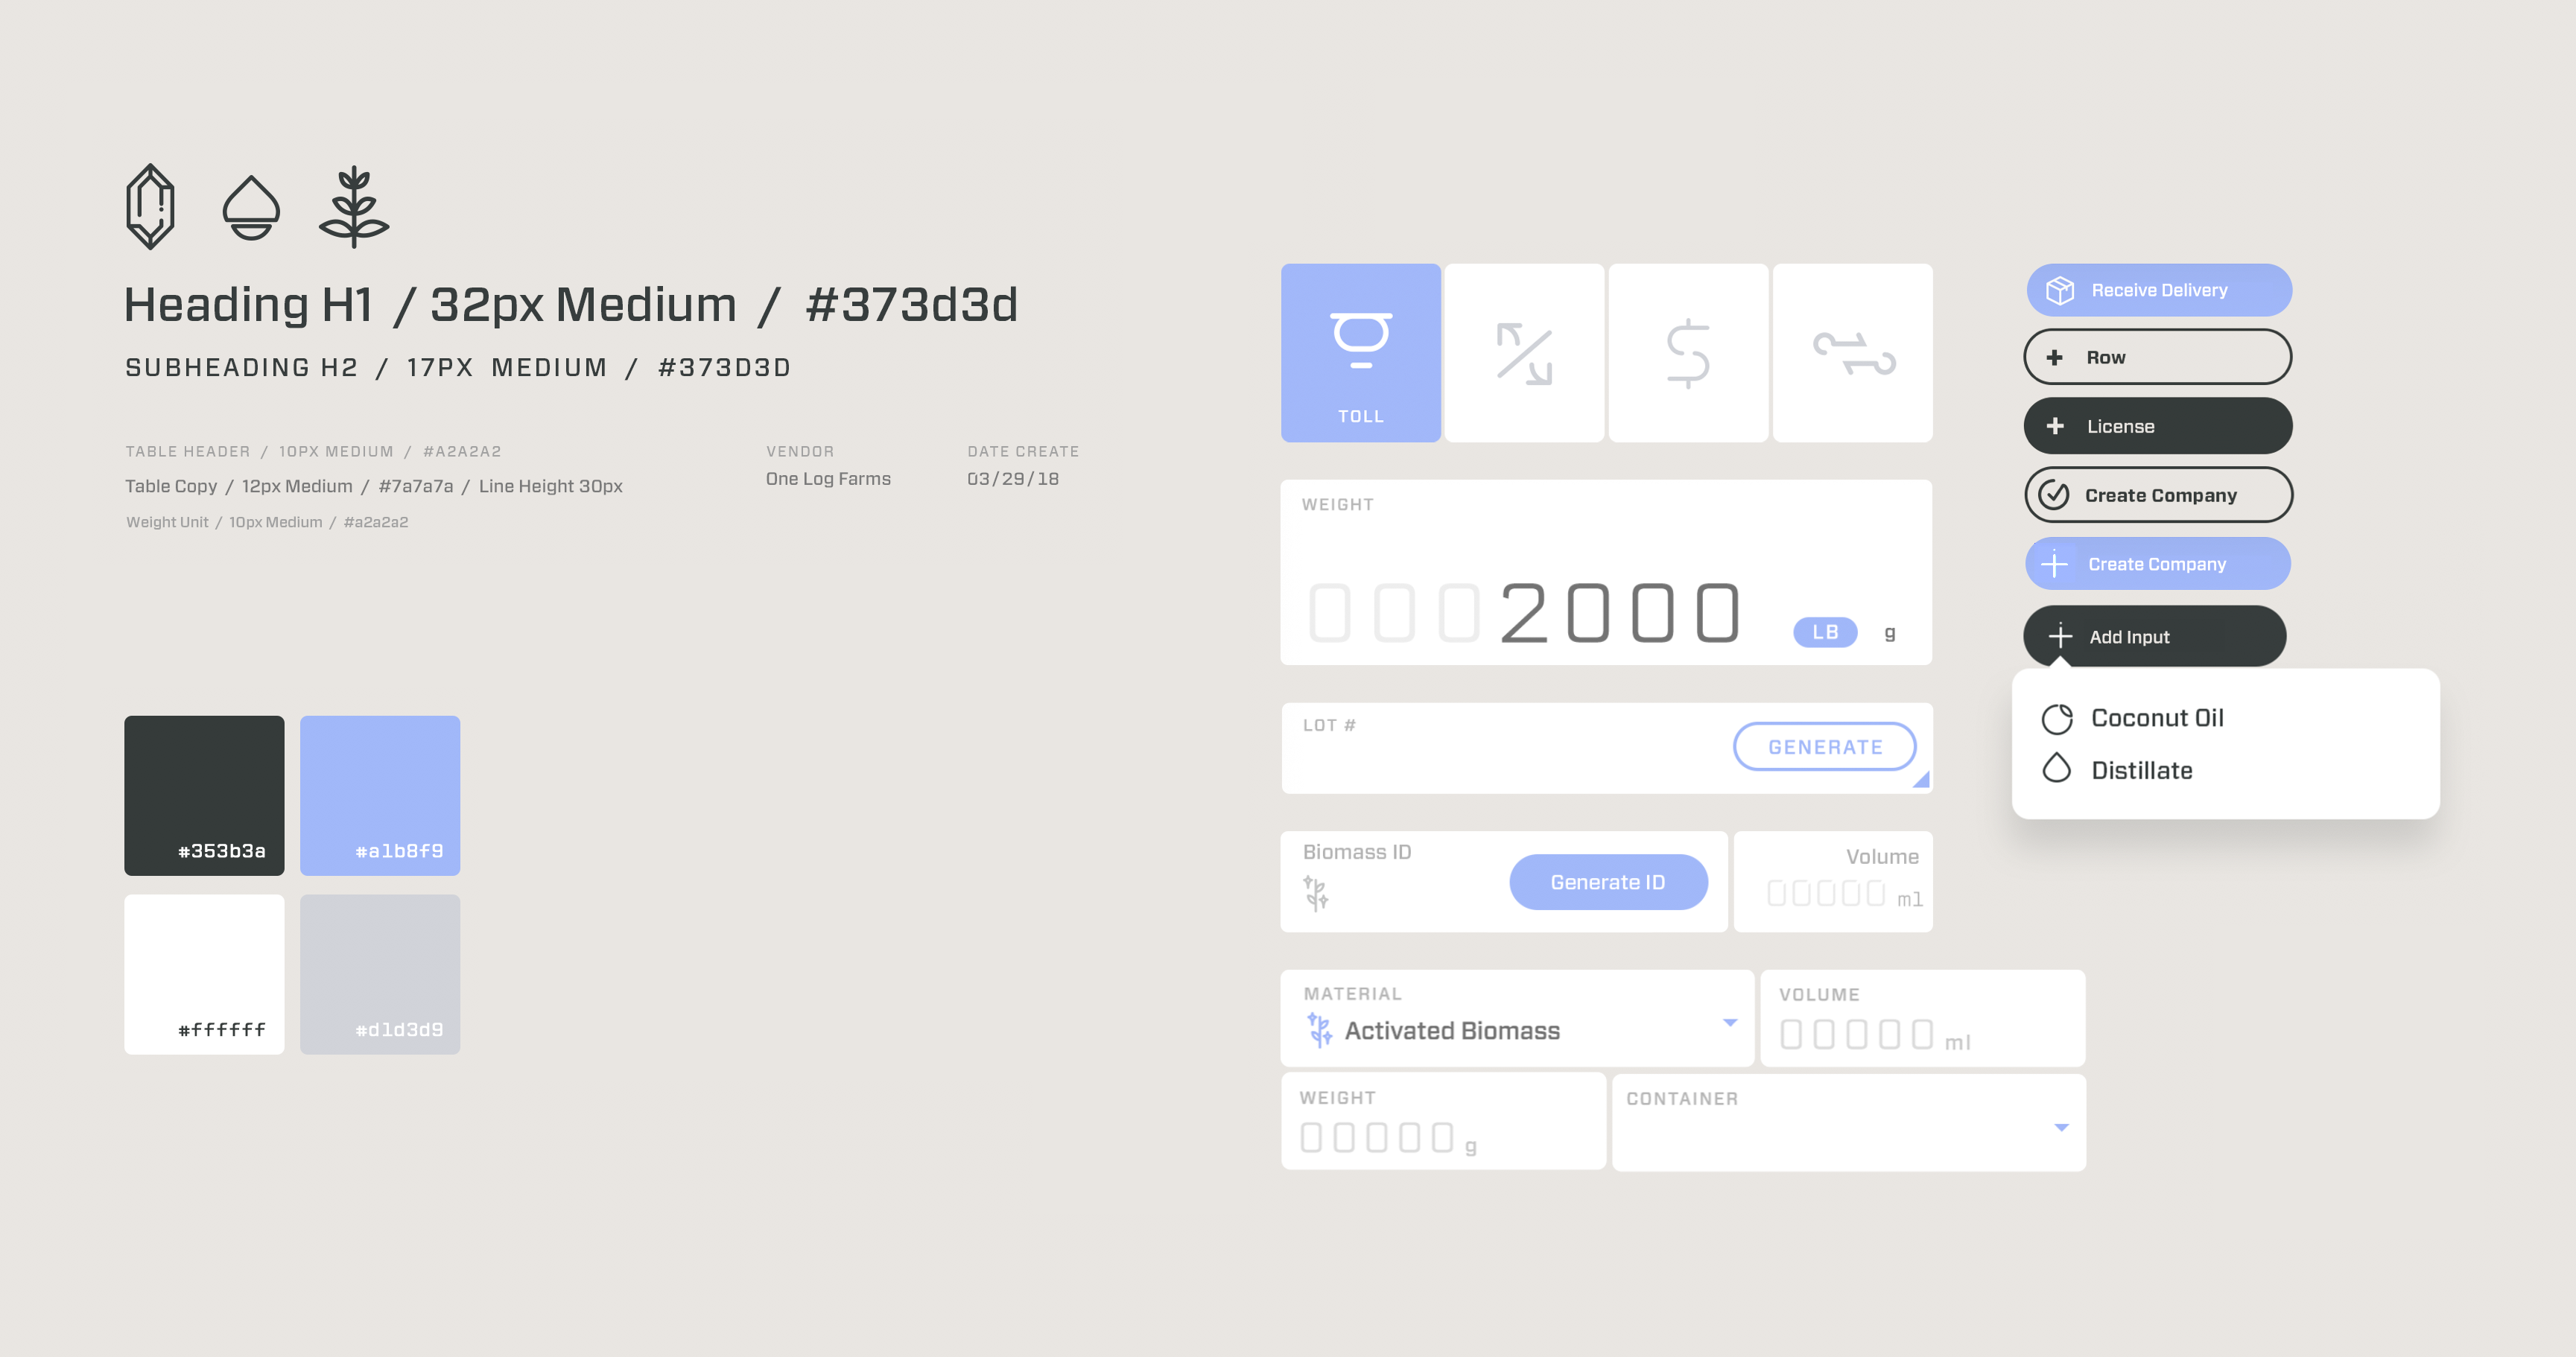
Atomic Component Library
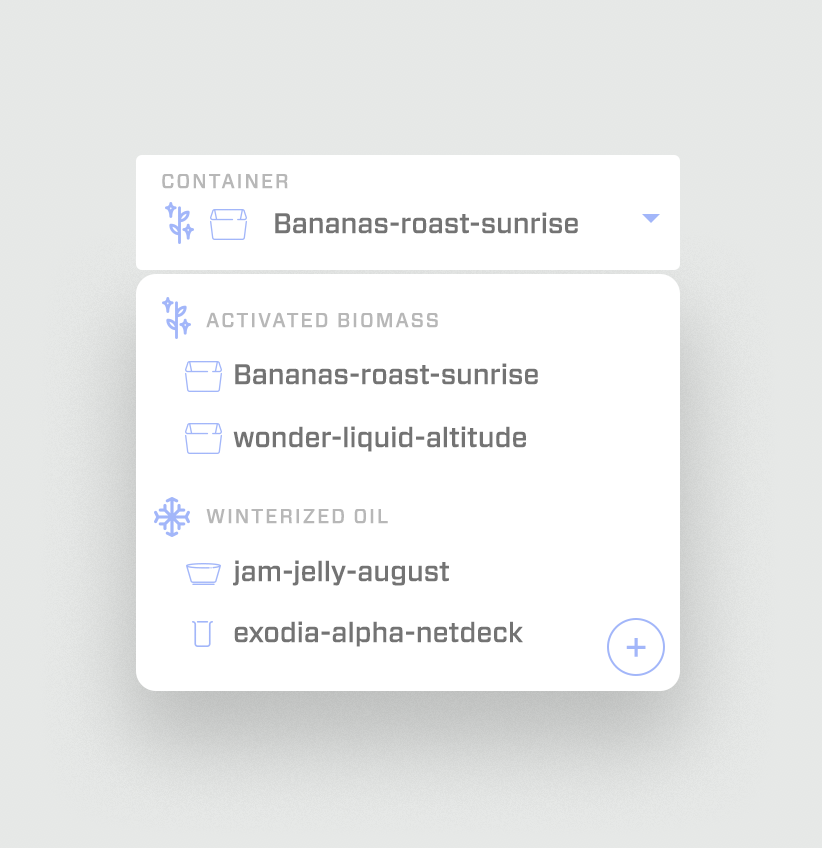
We built a custom react library. We included system icons when appropriate to further emphasis the association of an icon and a record. Zero states hint at the limits of the field and the data it expects to receive. We did all of this in the name of speed and stayed true to our philosophy of "Productivity Tool First". Do the job 3 inputs can do with just 1.




Art Direction
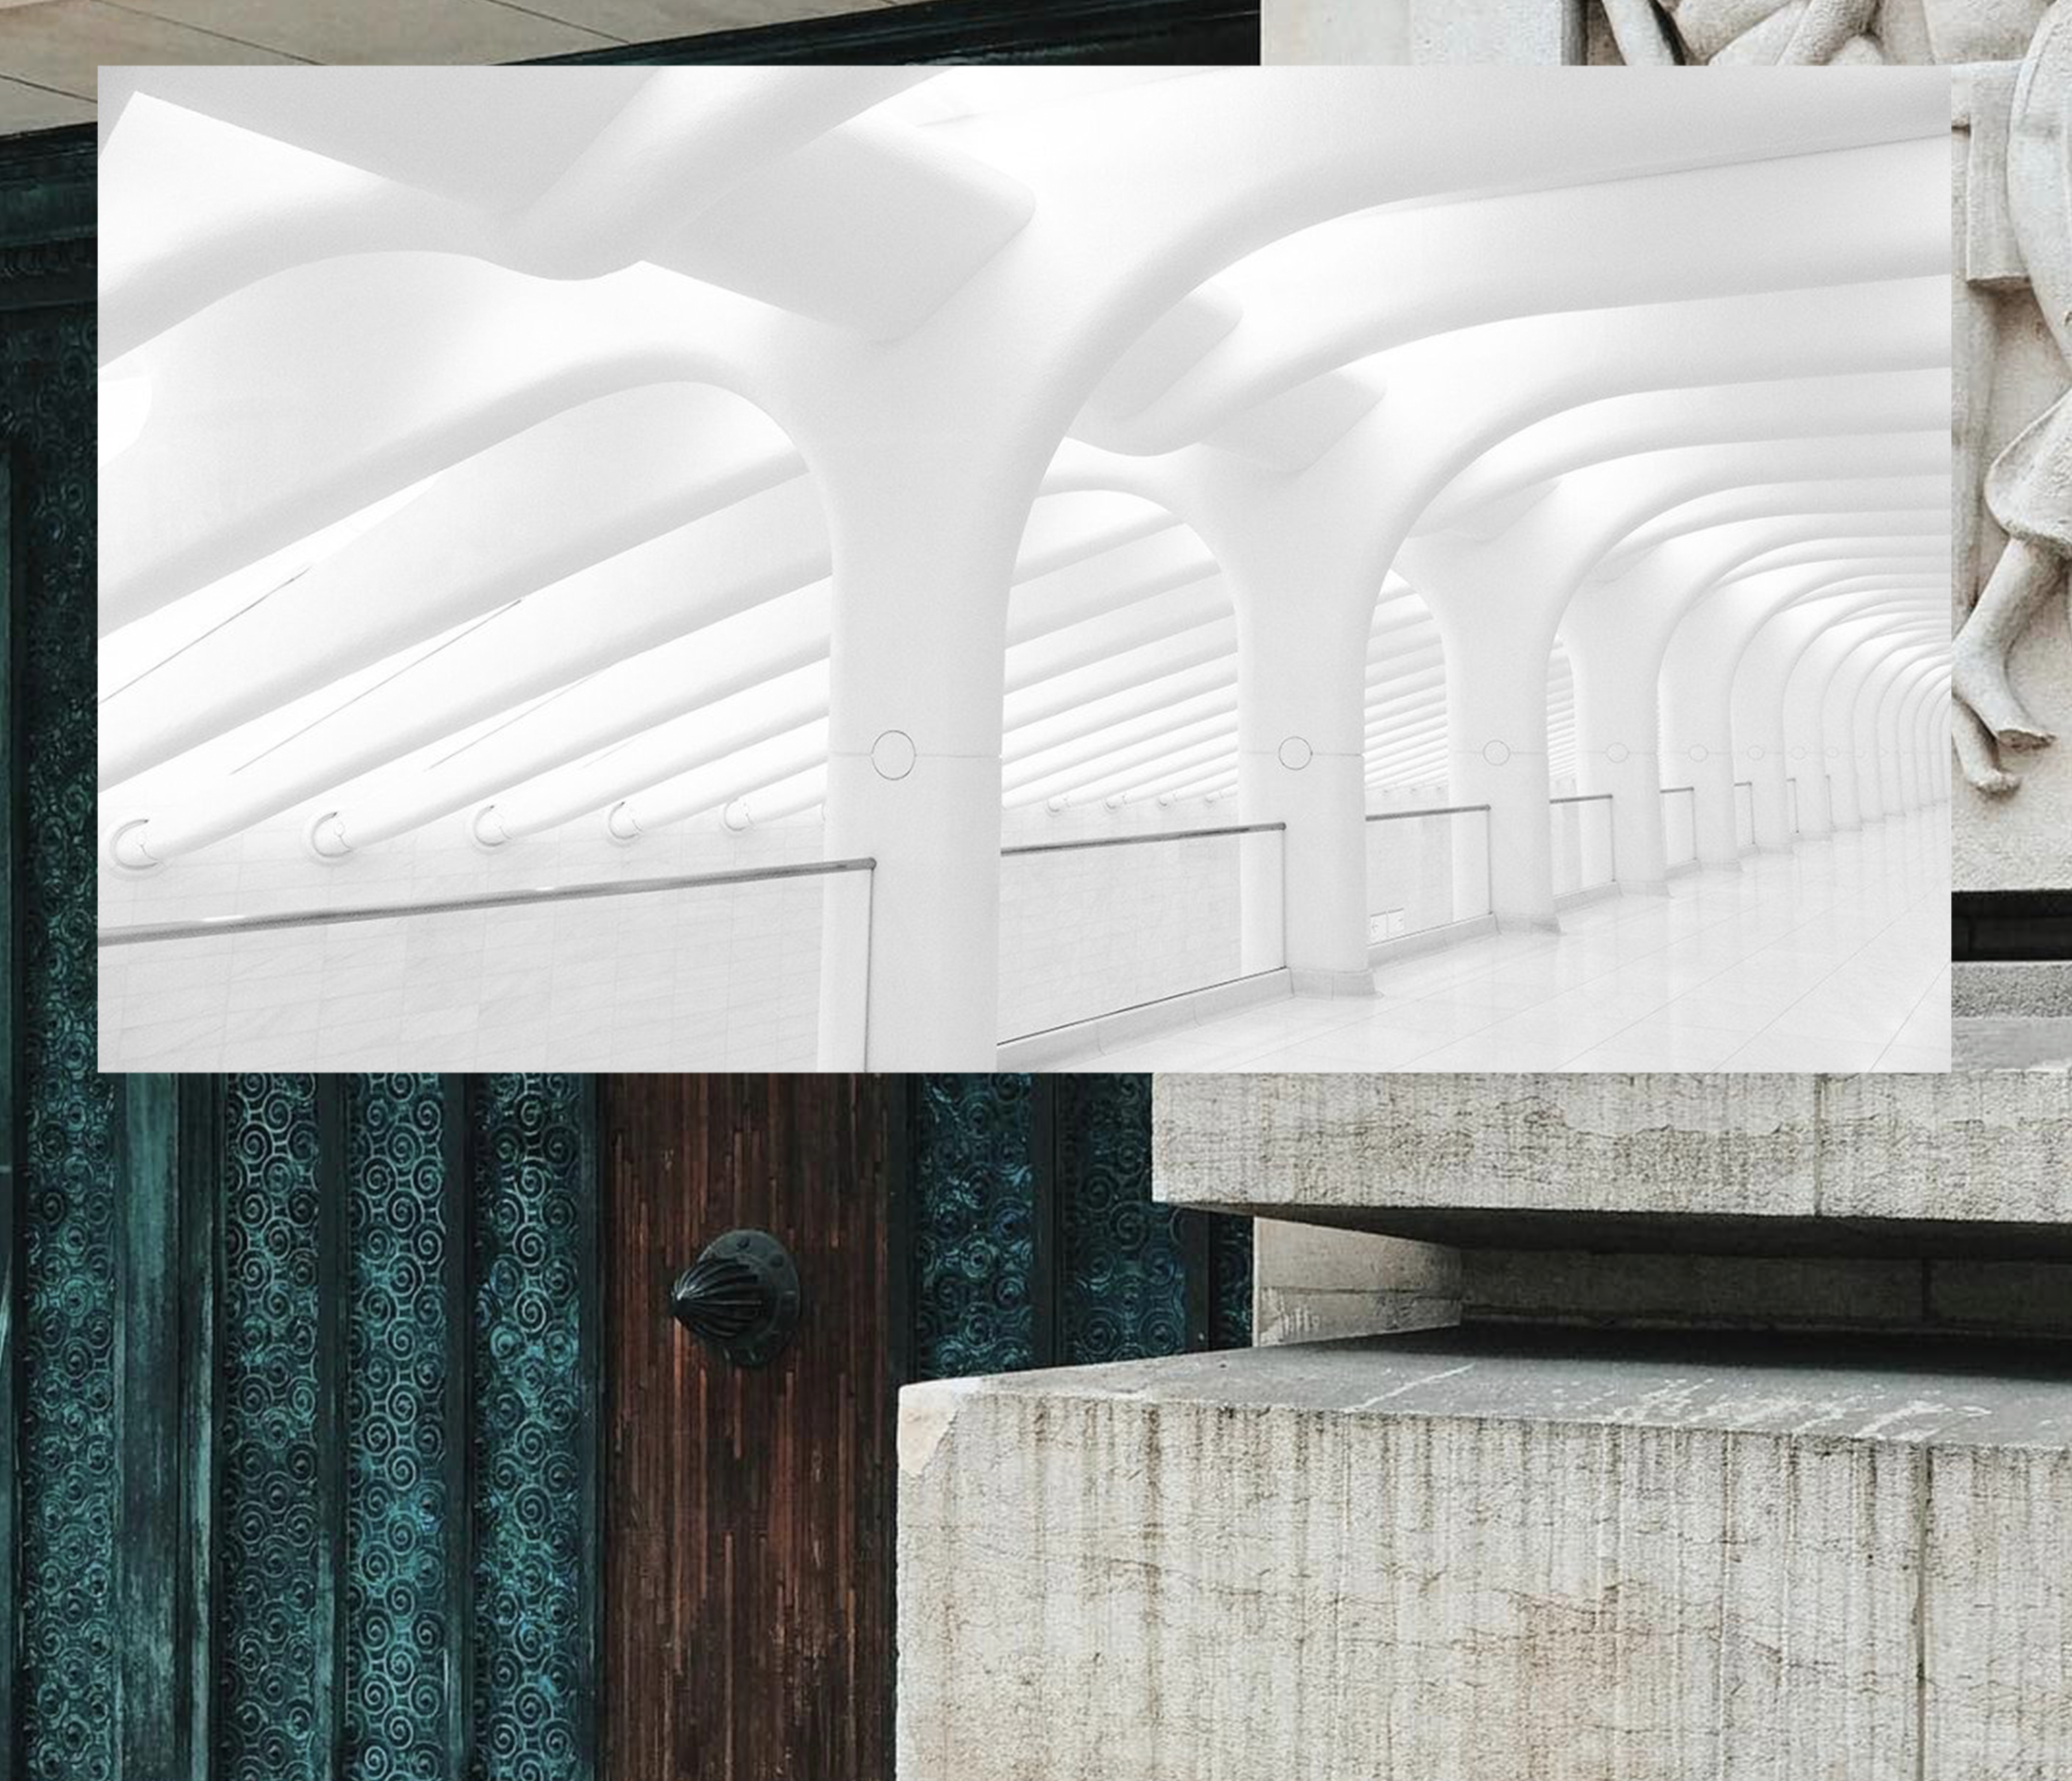
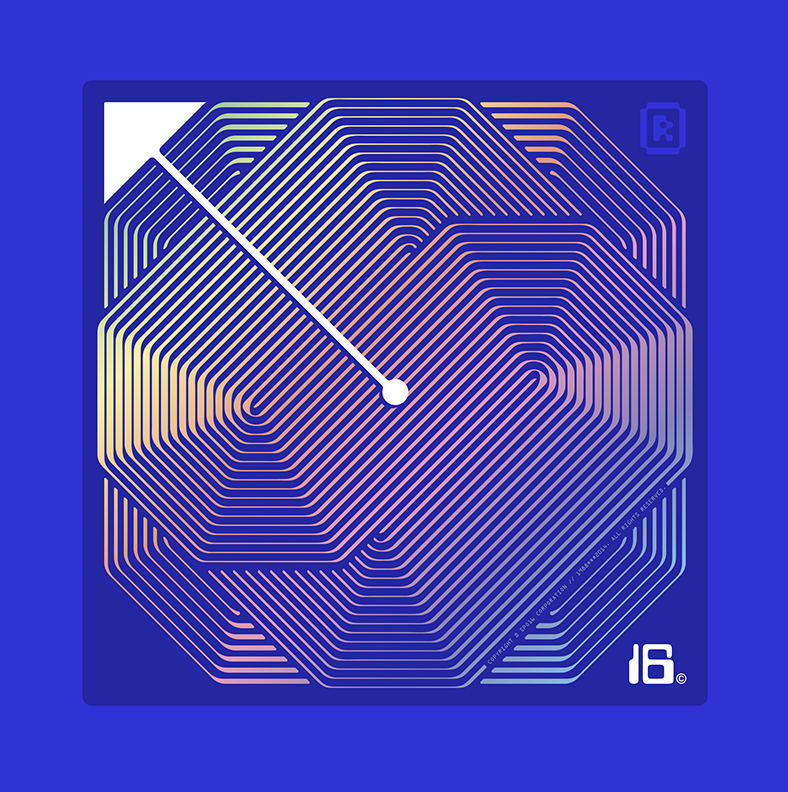
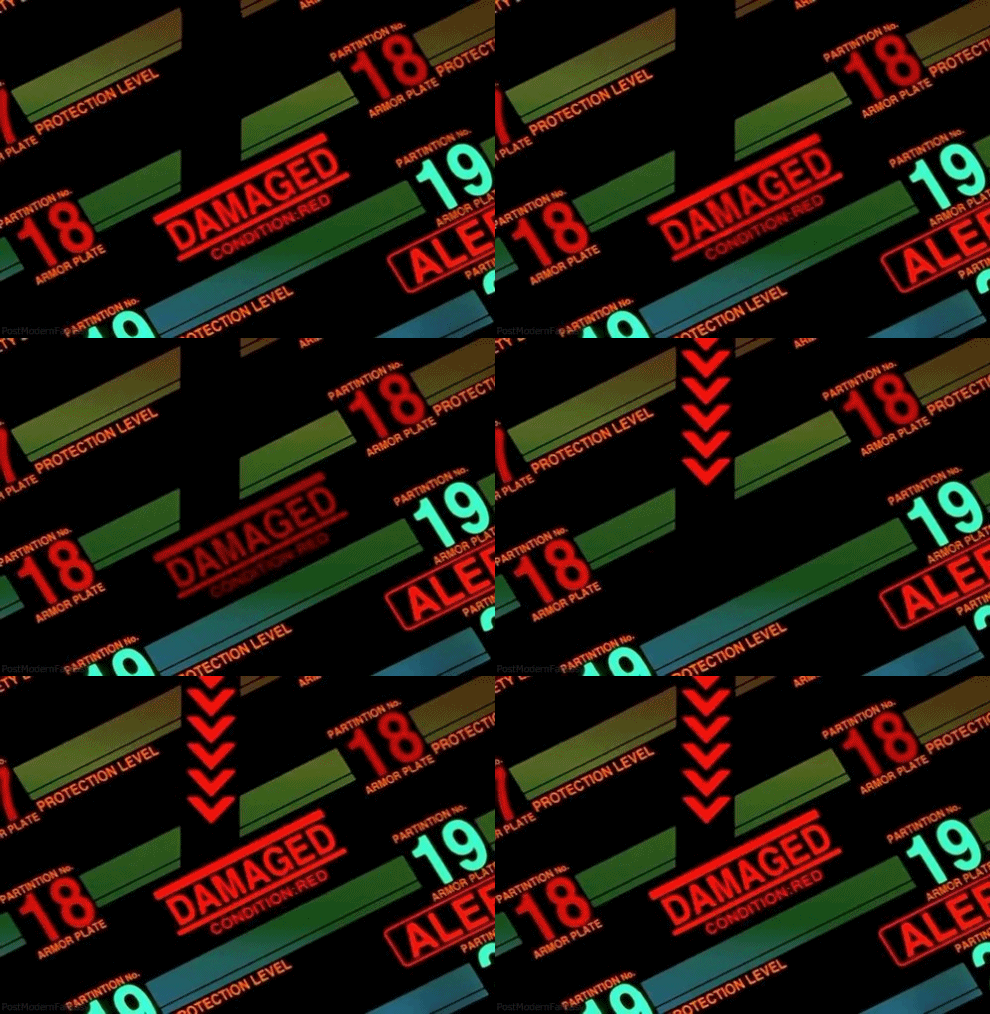
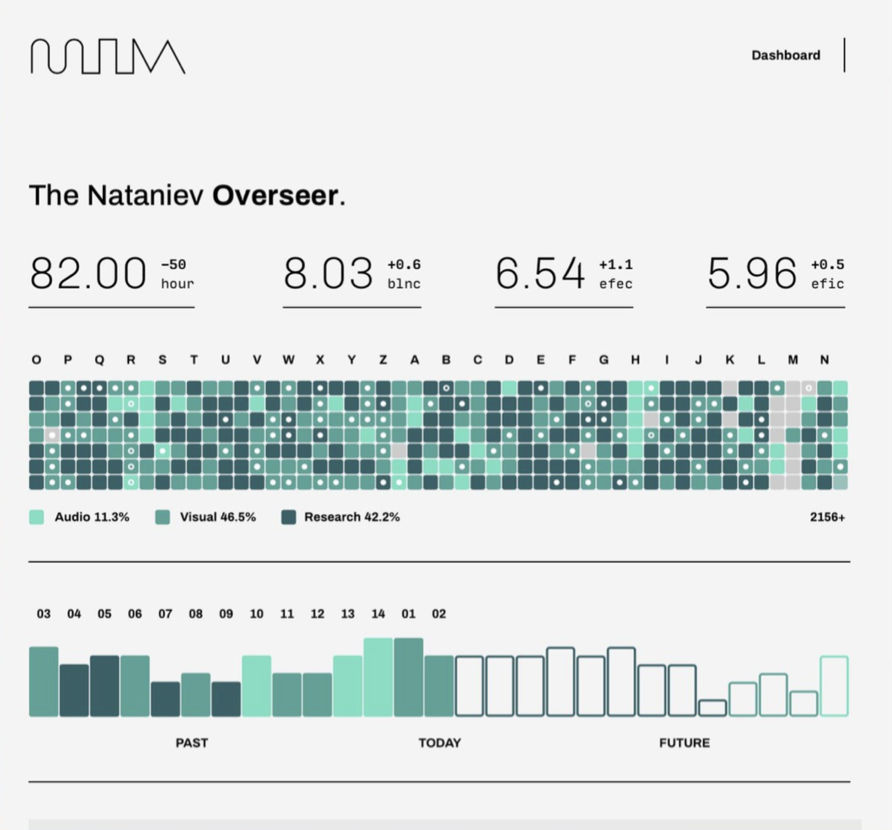
Inspiration + Psychology – We wanted to bring futuristic software to the paper and pencil world of cannabis. We played into the cognitive behavior that ff you give someone a lab coat and tell them they are a scientist, they make fewer errors. Being a productivity with mainly data entry and government regulation, reducing errors was a top priority.
Anatomy of a Table
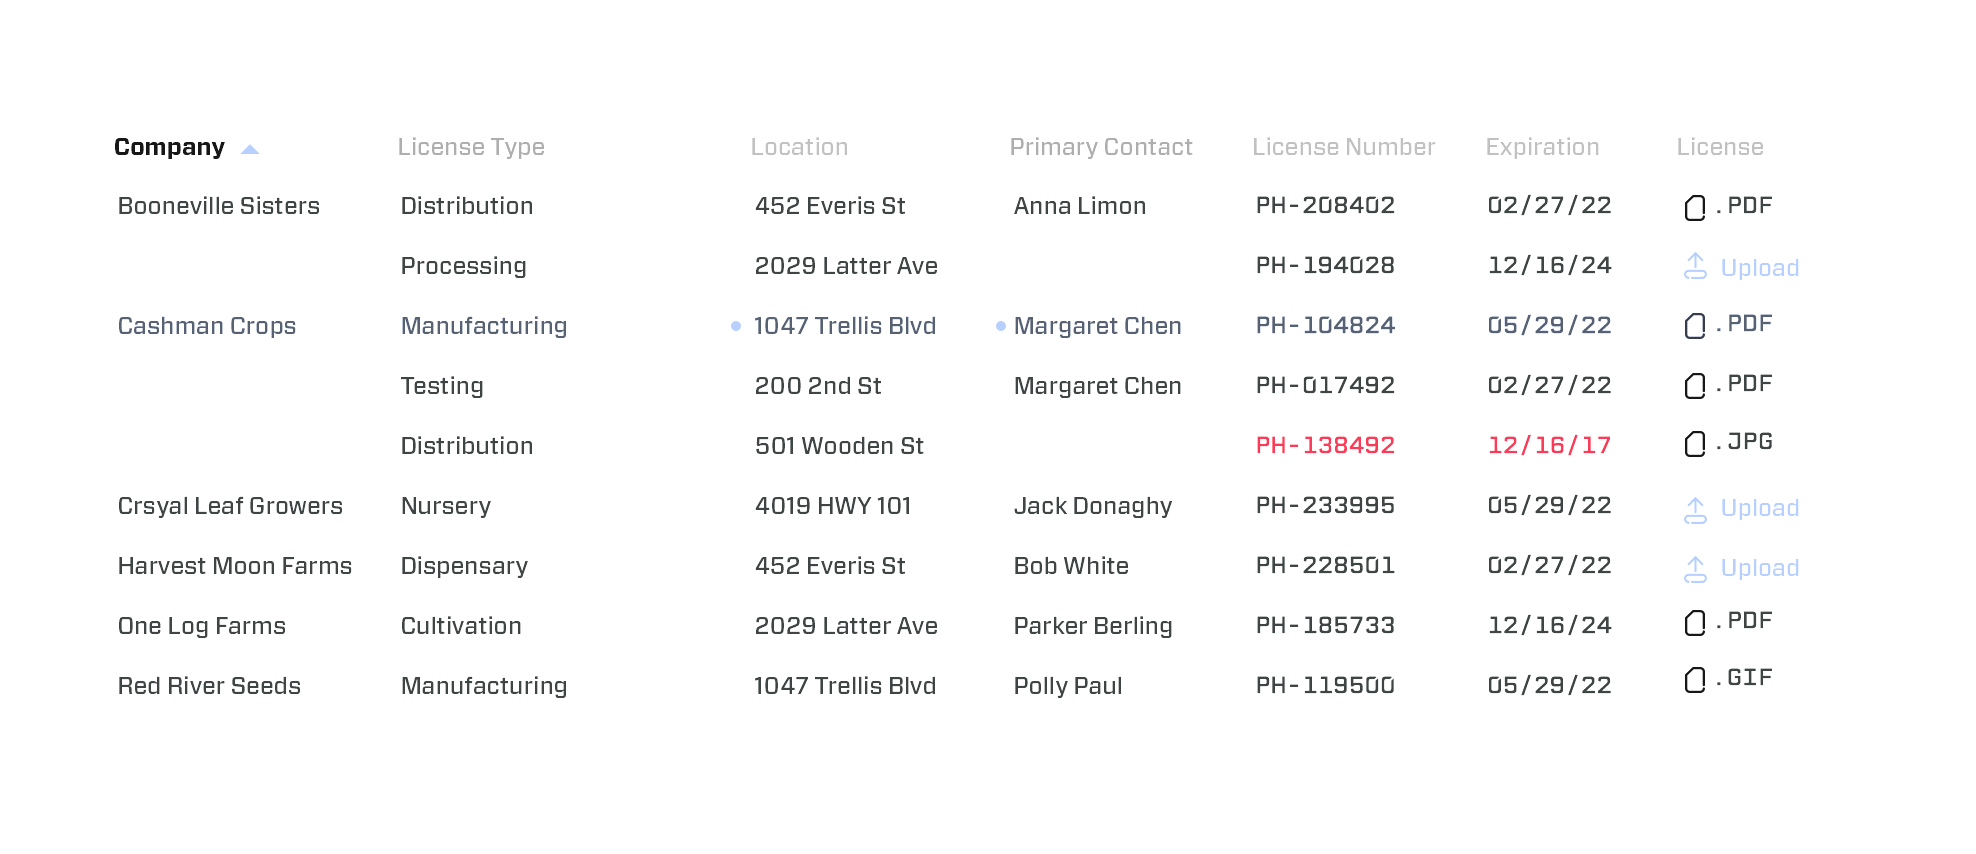
We came to a number of rules through scientific research, competitive analysis, and user feedback that guided our table design.
- Fixed Headers.
- Have a clear main row object.
- Column order matters.
- Object record first, modifier, then meta attributes.
- Responsive column resize based on screen width.
- No row striping, instead use proximity and spacing.
- Minimal font usage.
- Columns resize to contents.
- Nesting to show hierarchy and grouping.
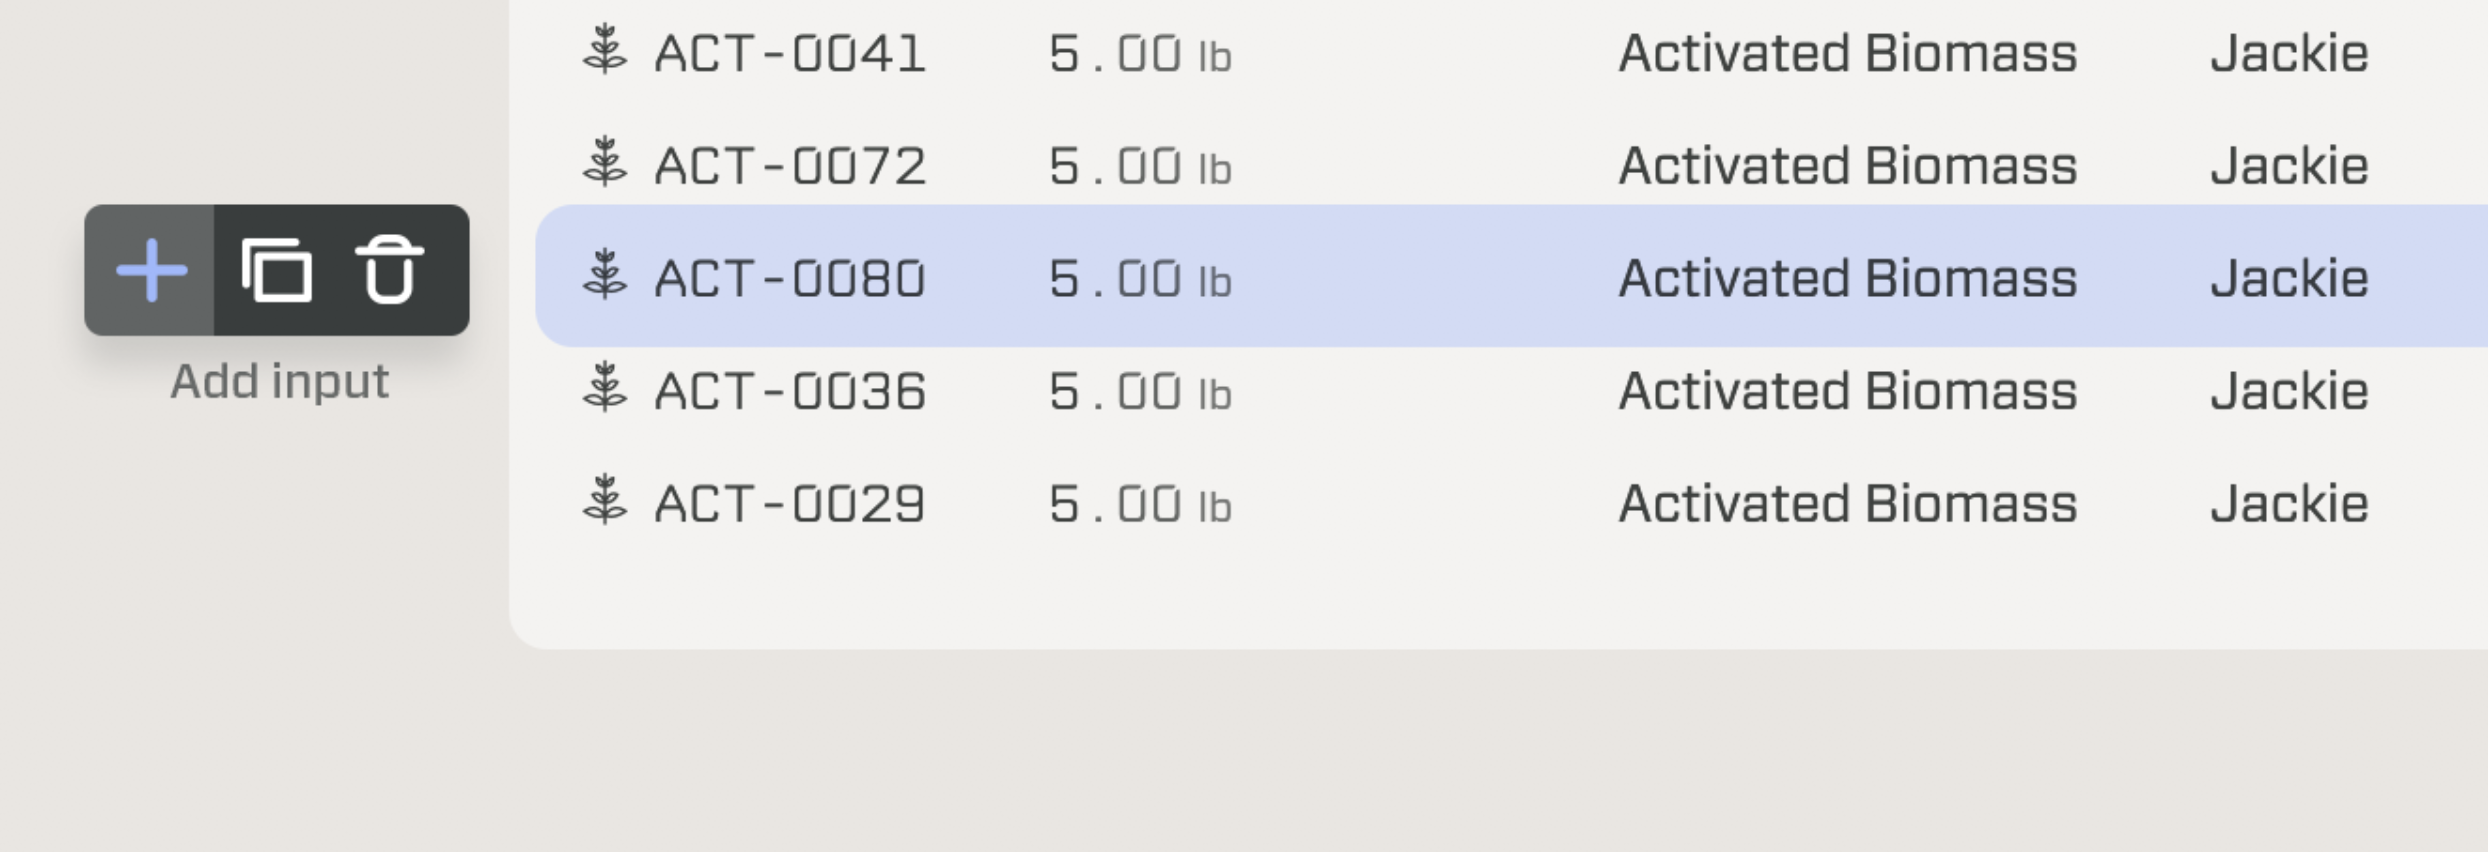
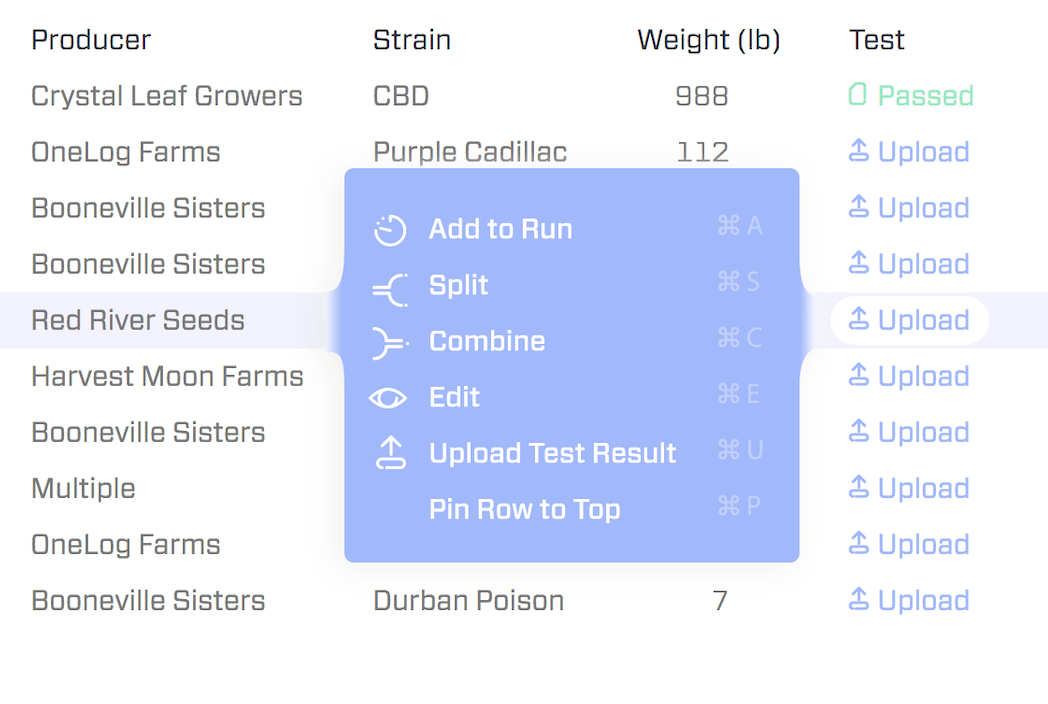
- Add/Edit inline + hidden actions.
- Expandable row records.
- Clear sorting direction.
- Align columns + headers properly to the data.

Microinteractions
- Speed and discoverable complexity for the adept power user.
- Intuitive actions when expected, uncluttered interface at rest.
- Bring delight to the mundane of data entry.
- Hotkeys!

Modal Inventory
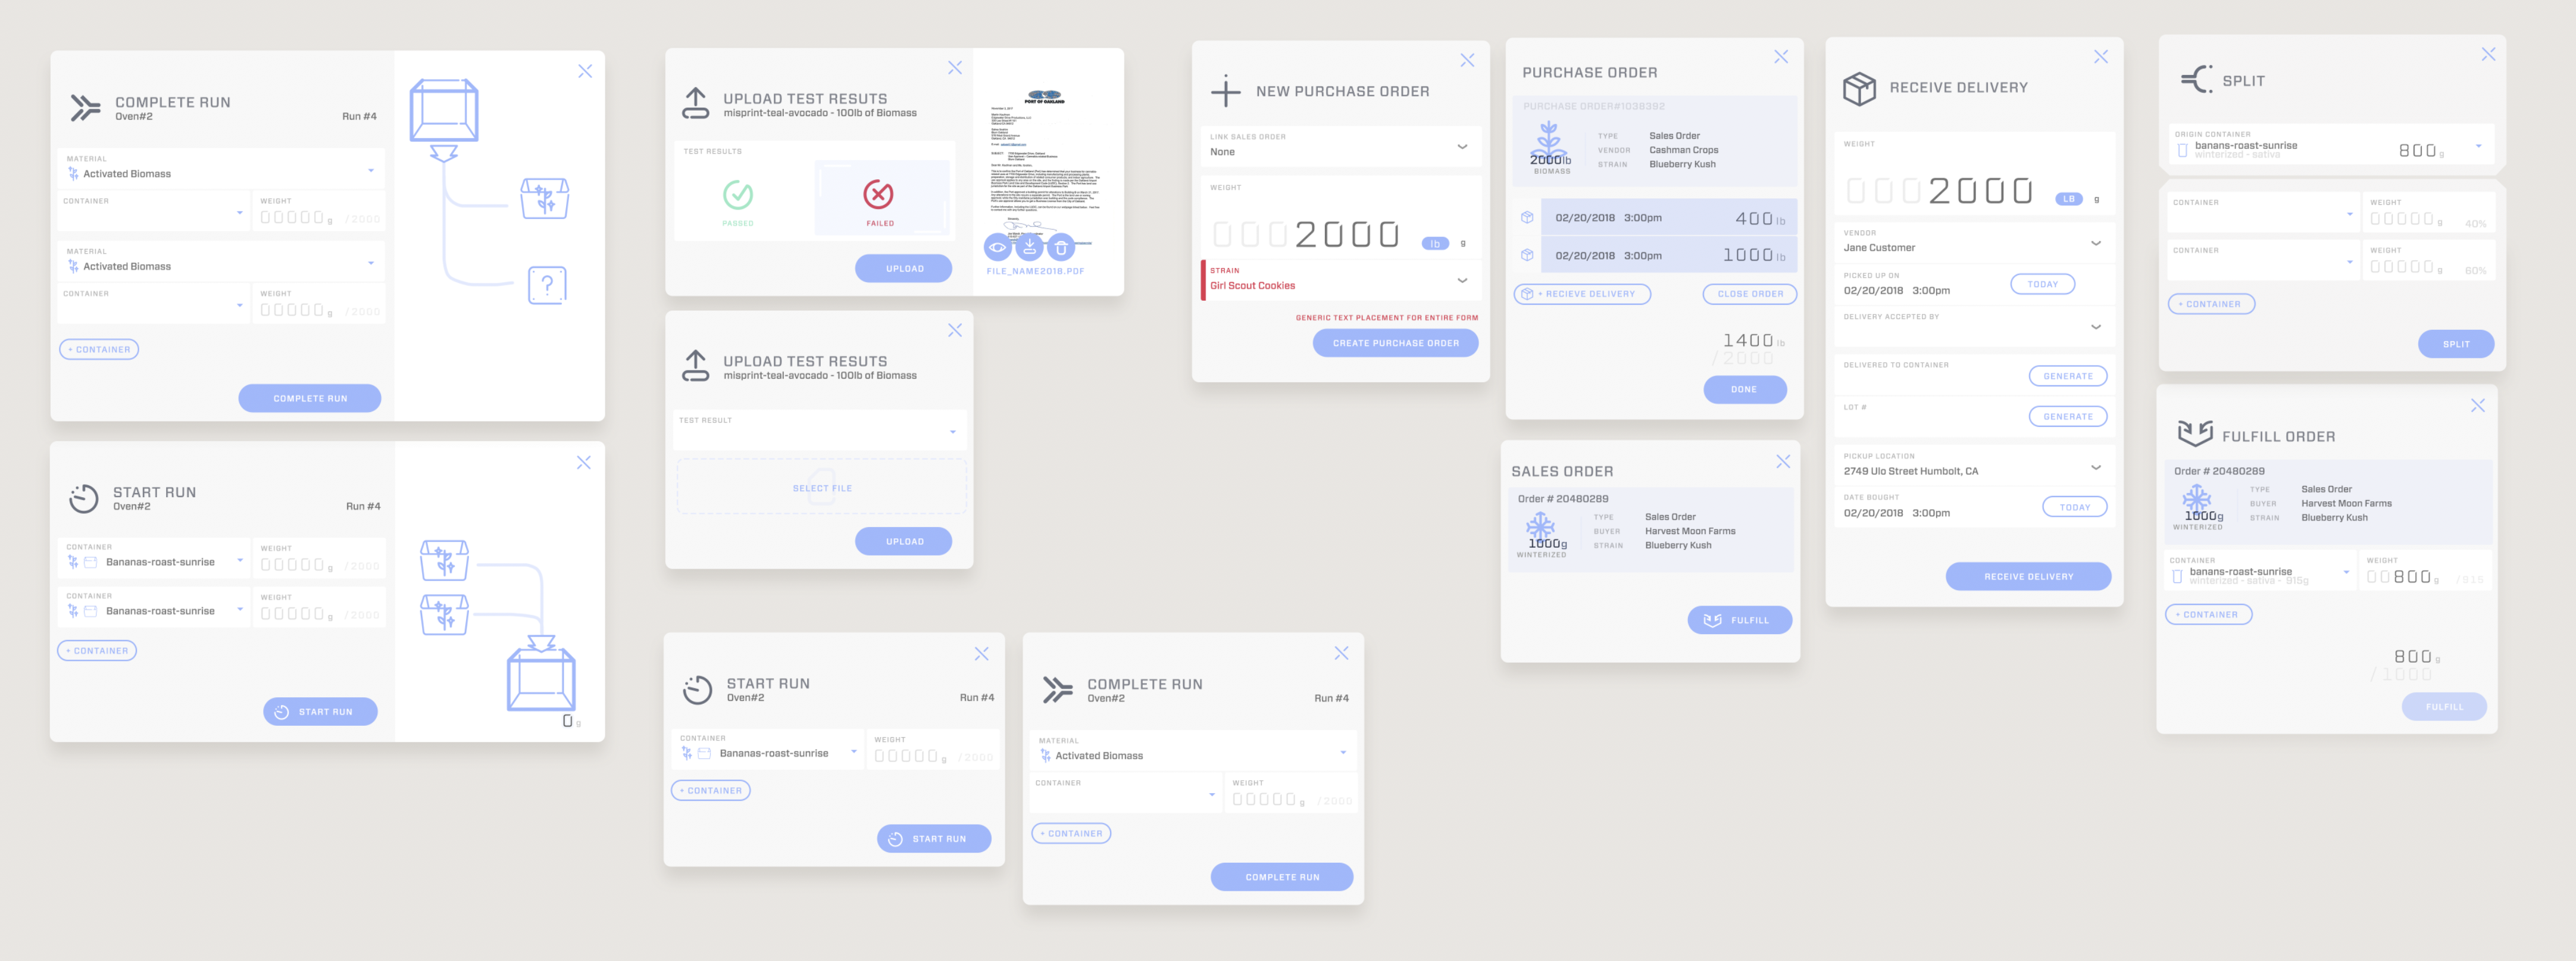
The main interaction moments of the software happen in modals and tables. We created and iterated onn a reusable modal template to facilitate quick code turn arounds for customer feature requests.
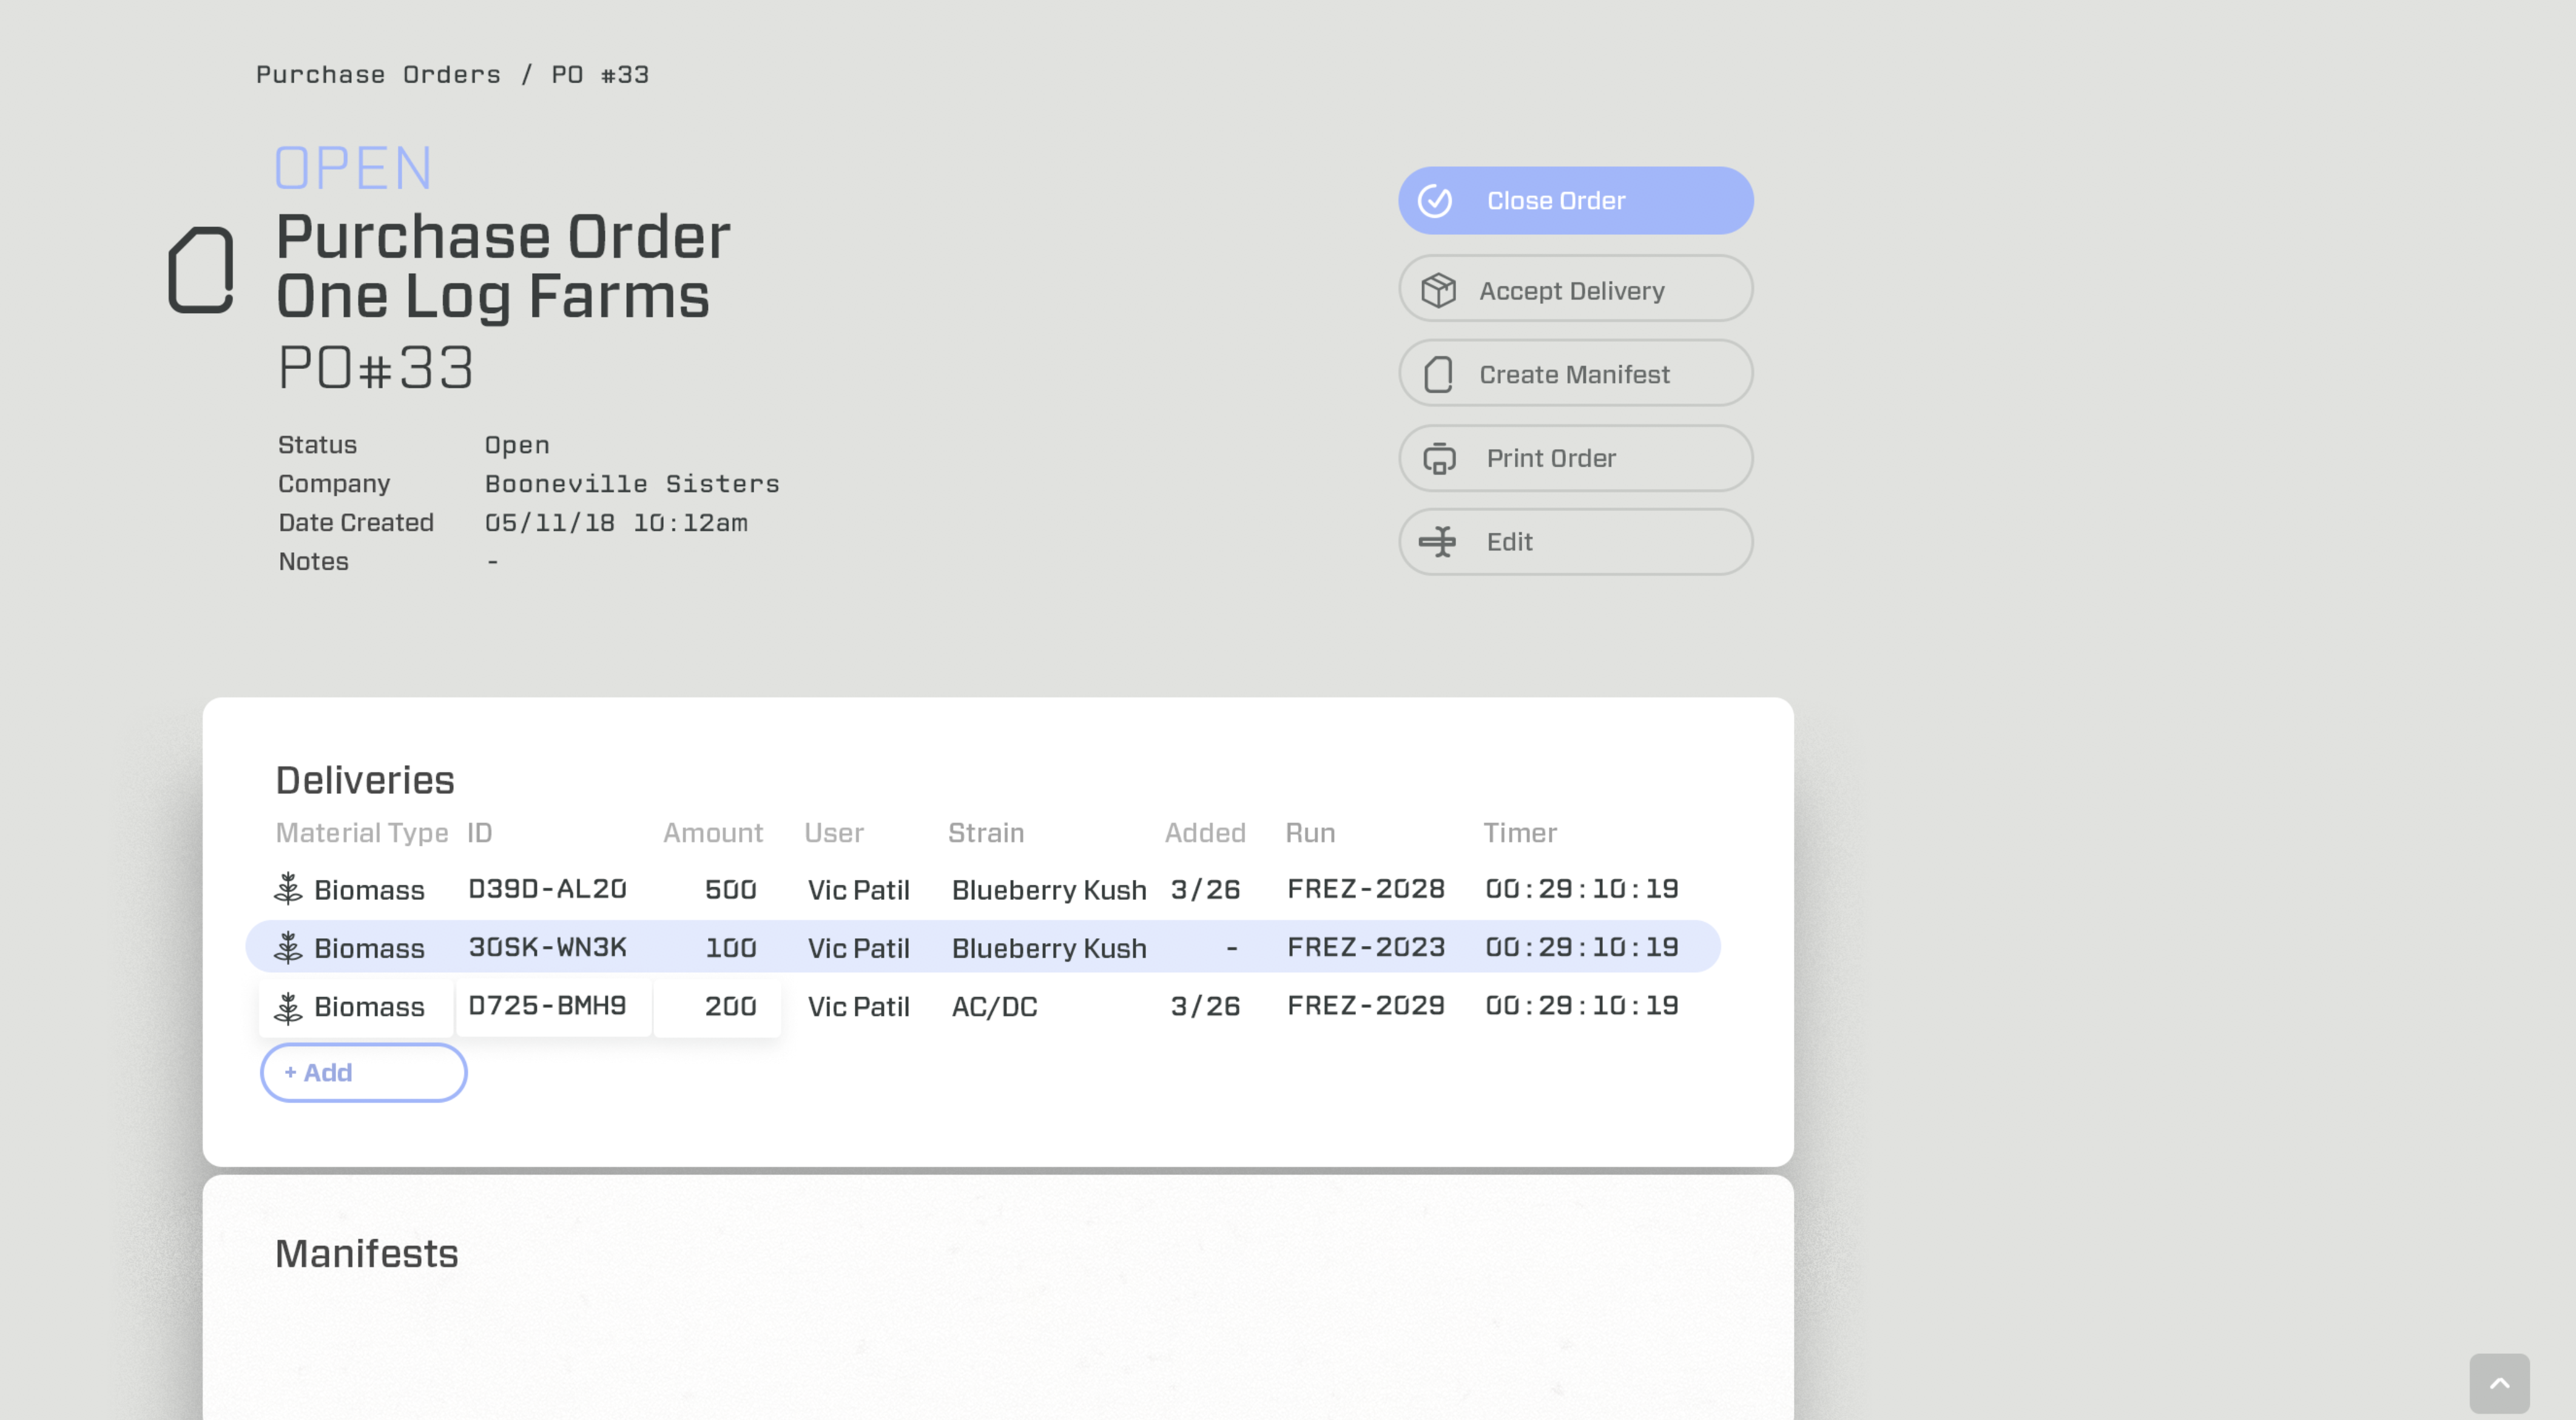 Purchase Order
 Production Que
 Production Home